library(tidyverse)
library(ggplot2)

knitr::opts_chunk$set(echo = TRUE, warning=FALSE, message=FALSE)
Challenge 9
Creating a function
Challenge Overview
Today’s challenge is simple. Create a function, and use it to perform a data analysis / cleaning / visualization task:
Examples of such functions are: 1) A function that reads in and cleans a dataset.
2) A function that computes summary statistics (e.g., computes the z score for a variable).
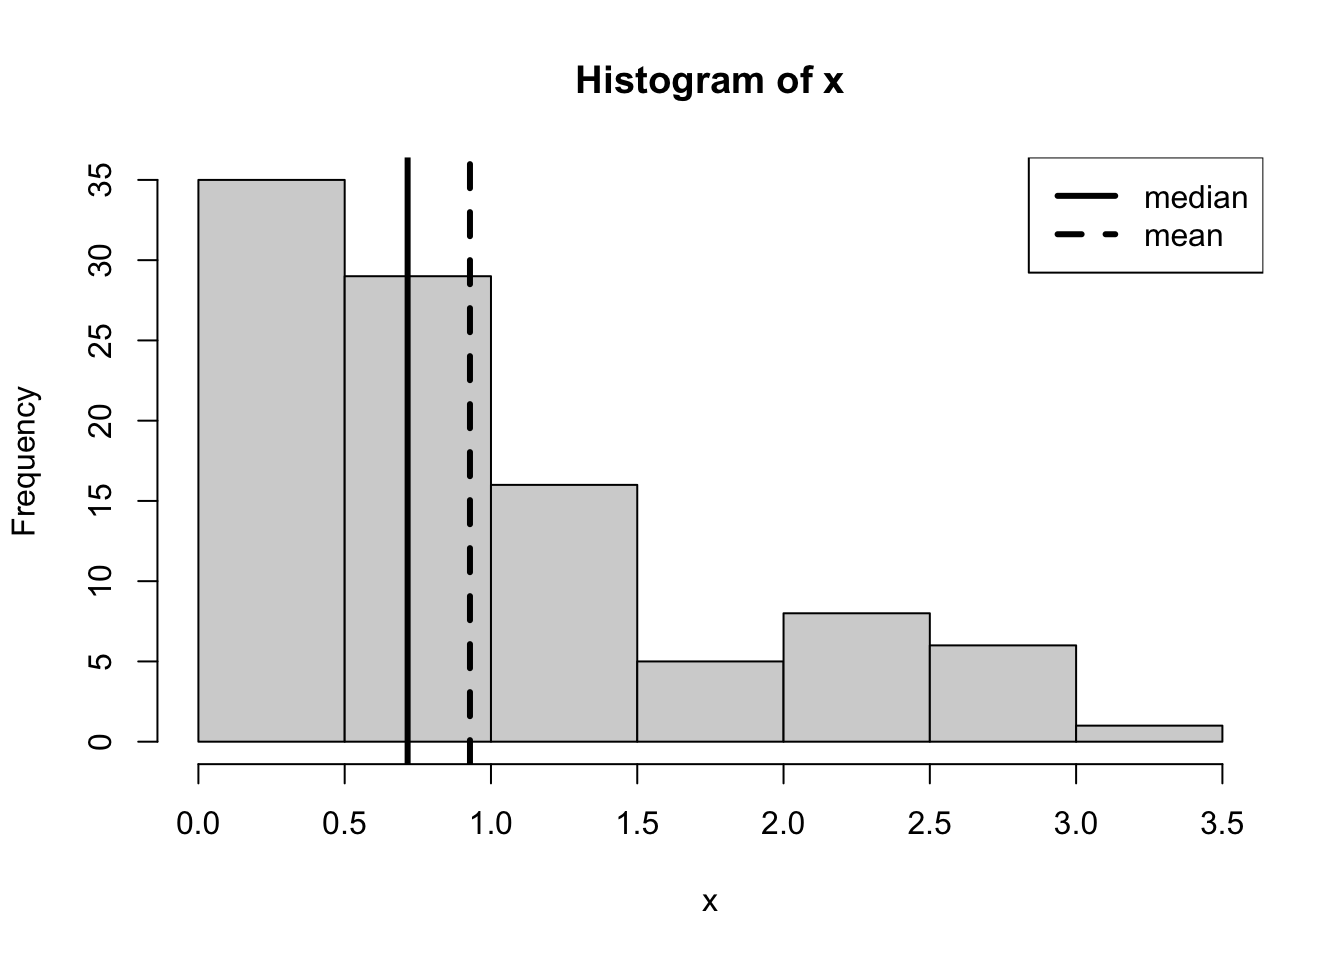
3) A function that plots a histogram.
That’s it!
#A function that computes summary statistics
My.Mean <- function(x) {

  Output <- sum(x) / length(x)

  return(Output)

}
My.Mean(0:10)
[1] 5#A function that plots a histogram
My.Hist <- function(x, add.median = T, add.mean = T, add.legend = T) {

  hist(x)

  if(add.median == T) {abline(v = median(x), lwd = 3)}

  if(add.mean == T) {abline(v = mean(x), lty = 2, lwd = 3)}

  if(add.legend == T) {

    legend("topright", c("median", "mean"), lwd = c(3, 3), lty = c(1, 2))

  }
}

My.Hist(rexp(100), add.median = T, add.mean = T, add.legend = T)