library(tidyverse)
library(ggplot2)

knitr::opts_chunk$set(echo = TRUE, warning=FALSE, message=FALSE)
Challenge 9 Post: Creating Functions for the Cereal Dataset
challenge_9
cereal
Creating a function
Challenge Overview
Today’s challenge is simple. Create a function, and use it to perform a data analysis / cleaning / visualization task:
Examples of such functions are: 1) A function that reads in and cleans a dataset.
2) A function that computes summary statistics (e.g., computes the z score for a variable).
3) A function that plots a histogram.
That’s it!
Solution
For Challenge 9, I am going to read in the cereal.csv dataset. Since cereal.csv is already meets the qualifications for being a tidy dataset, I’ll aim to create the two latter functions described in the instructions–creating a function that computes the z-score for a variable and creating a function that plots a histogram.
Reading in the data
# Reading in cereal.csv
cereal_1 <- read_csv("_data/cereal.csv")
cereal_1
Creating function, calculate_z_score, to compute z-scores for Sodium and Sugar variables
# Creating function to compute z-scores
calculate_z_score <- function(col_name) {
  z_score <- (col_name - mean(col_name)) / sd(col_name)
  return(z_score)
}

# Using z-score function for Sodium variable in cereal_1 dataset
calculate_z_score(cereal_1$Sodium)
[1] -2.16146621 2.23912368 -1.25546241 -0.34945861 0.42711608 0.16825785
[7] 0.55654519 -0.22002949 -0.86717507 -0.47888772 -0.34945861 0.16825785
[13] 0.29768696 -0.09060038 1.59197810 -1.51432064 0.68597431 0.16825785
[19] 0.42711608 0.55654519# Using z-score function for Sugar variable in cereal_1 dataset
calculate_z_score(cereal_1$Sugar) [1] 0.42293060 1.73871469 -0.70488433 0.98683807 0.61089976 -1.45676096
[7] 0.23496144 1.36277638 -1.64473011 0.61089976 0.98683807 -0.32894602
[13] 0.04699229 -0.51691518 -1.08082265 1.17480722 -0.89285349 -0.89285349
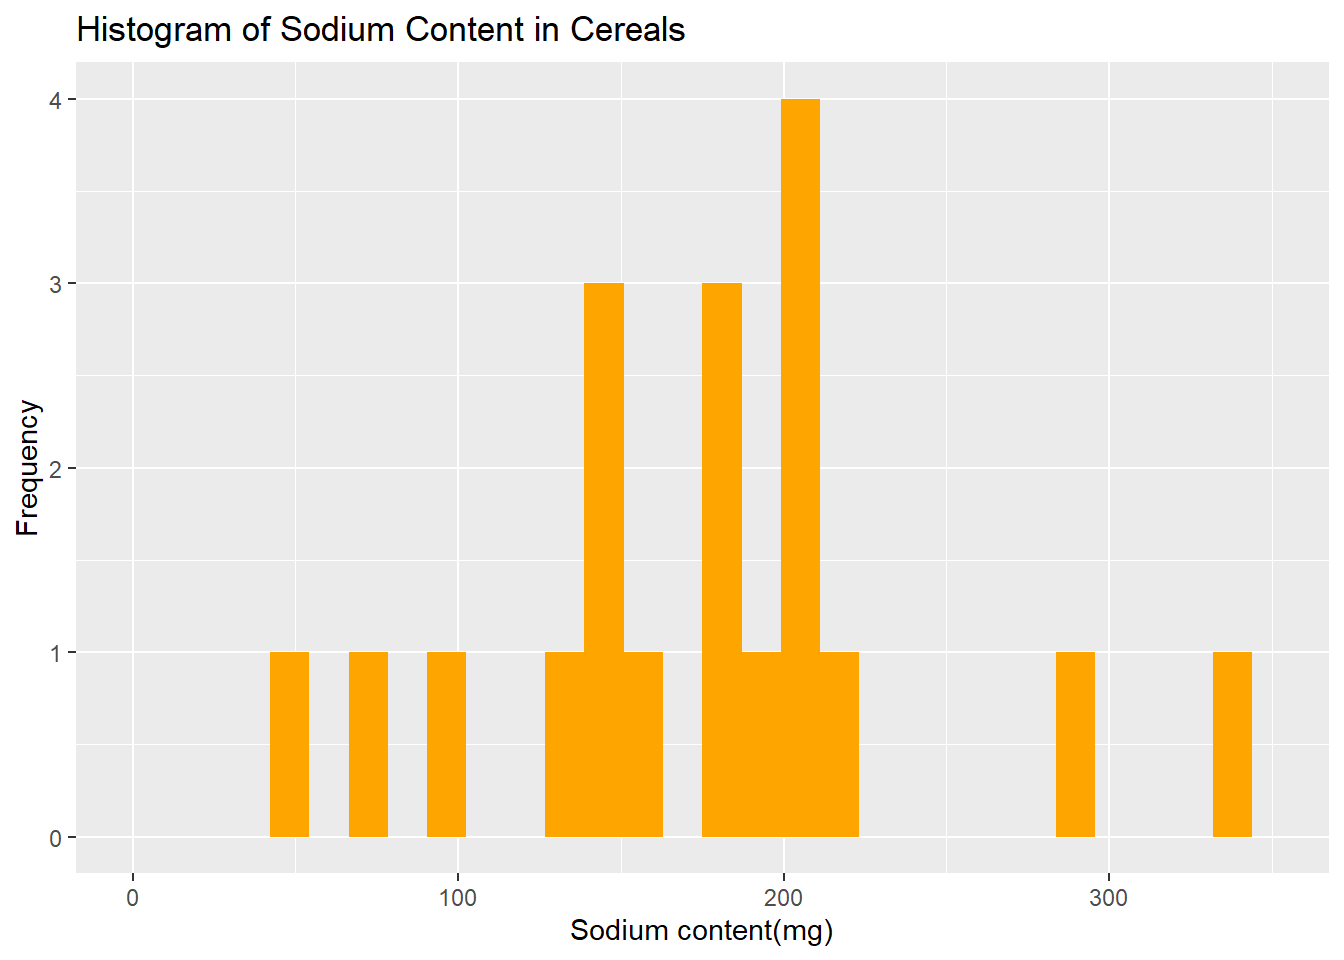
[19] -1.08082265 0.42293060Creating function, build_histogram, to make histograms for the Sodium variable
# Creating a function, build_histogram, to make a histogram
build_histogram <- function(data, col_name, title, fill="orange", xlab="x", ylab= "Frequency", x_max= 350, y_max= 4) {
  data %>%
    ggplot(aes({{col_name}})) + geom_histogram(fill= fill)+ labs(x=xlab, y=ylab, title= title) + xlim(0,x_max)+ ylim(0,y_max)
}

# Using histogram function for Sodium variable in cereal_1 dataset
build_histogram(cereal_1, Sodium, "Histogram of Sodium Content in Cereals", xlab = "Sodium content(mg)", ylab = "Frequency")