library(tidyverse)
library(ggplot2)

knitr::opts_chunk$set(echo = TRUE, warning=FALSE, message=FALSE)
Challenge 9 solution
challenge_9
Creating a function
Challenge Overview
Today’s challenge is simple. Create a function, and use it to perform a data analysis / cleaning / visualization task:
Examples of such functions are: 1) A function that reads in and cleans a dataset.
2) A function that computes summary statistics (e.g., computes the z score for a variable).
3) A function that plots a histogram.
That’s it!
# Specify the file path
file_path <- "_data/eggs_tidy.csv"

# 1. Read and clean a dataset
read_and_clean <- function(file_path) {
    # Read the data
    data <- read.csv(file_path, header = FALSE)

    # Set column names
    colnames(data) <- c('Month', 'Year', 'Val1', 'Val2', 'Val3', 'Val4')

    # Convert numeric columns to numeric data type
    data$Val1 <- as.numeric(as.character(data$Val1))
    data$Val2 <- as.numeric(as.character(data$Val2))
    data$Val3 <- as.numeric(as.character(data$Val3))
    data$Val4 <- as.numeric(as.character(data$Val4))

    # Handle potential non-numeric values
    data$Val1[is.na(data$Val1)] <- mean(data$Val1, na.rm = TRUE)
    data$Val2[is.na(data$Val2)] <- mean(data$Val2, na.rm = TRUE)
    data$Val3[is.na(data$Val3)] <- mean(data$Val3, na.rm = TRUE)
    data$Val4[is.na(data$Val4)] <- mean(data$Val4, na.rm = TRUE)

    # Return the clean data
    return(data)
}

# Read and clean the data
clean_data <- read_and_clean(file_path)

# 2. Compute summary statistics (e.g., computes the z score for a variable)
compute_z_score <- function(data, column_name) {
    column <- data[[column_name]]
    z_scores <- (column - mean(column)) / sd(column)
    return(z_scores)
}

# Compute z-scores for 'Val1'
val1_z_scores <- compute_z_score(clean_data, 'Val1')

# 3. Plot a histogram
plot_histogram <- function(data, column_name) {
    hist(data[[column_name]], main = paste("Histogram of", column_name),
         xlab = column_name)
}

# Plot histogram for 'Val1'
plot_histogram(clean_data, 'Val1')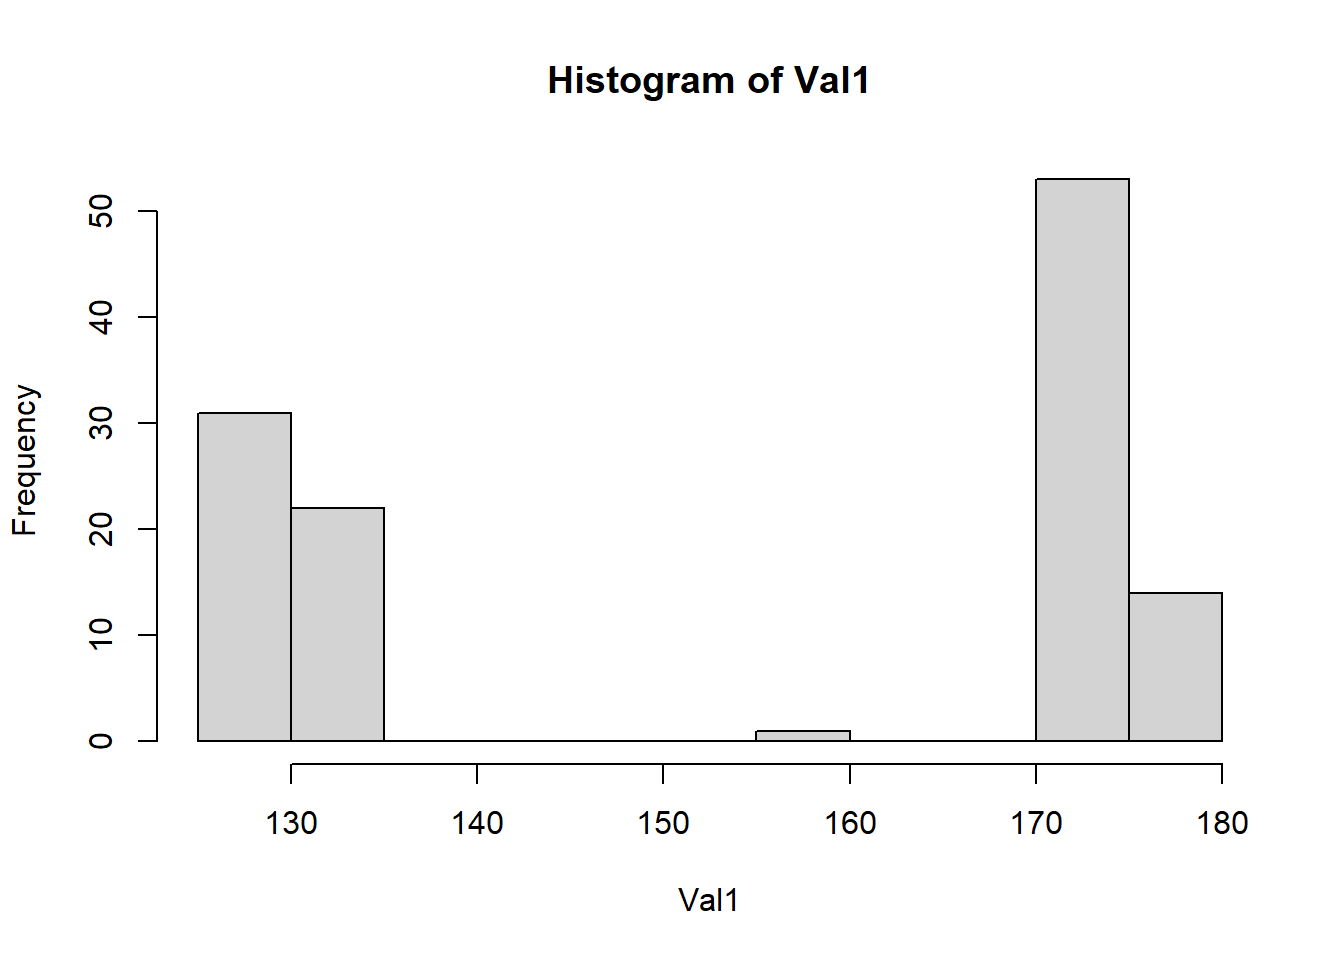
Let’s break this down. The code does three main things to analyze a dataset about egg prices.
First up, read_and_clean function. Think of it like a bouncer at a club. It reads the guest list (our data), then ensures everyone’s age (data type) is correct and that no one (no data) is missing.
Next, the compute_z_score function. This is like your school teacher who marks your test and tells you how far off you were from the class average. But here, we’re looking at things like egg prices instead of test scores.
Last, but not least, the plot_histogram function. This is like creating a bar chart of all the students’ heights in your class. But instead of student heights, we’re looking at whatever variable we’re interested in - could be egg prices, could be something else.