library(tidyverse)
library(ggplot2)

knitr::opts_chunk$set(echo = TRUE, warning=FALSE, message=FALSE)
Challenge 9
challenge_9
Creating a function
Challenge Overview
Today’s challenge is simple. Create a function, and use it to perform a data analysis / cleaning / visualization task:
Examples of such functions are: 1) A function that reads in and cleans a dataset.
2) A function that computes summary statistics (e.g., computes the z score for a variable).
3) A function that plots a histogram.
That’s it!
# Function call to read a csv file
cereal_df <- read_csv("_data/cereal.csv")
Function to create a univariate Pie-Chart based on a categorical variable
plot_pie_chart <- function(input_df, category_var, chart_title) {

  # Mutating the dataset
  split_by_type <- count(input_df, across(all_of(category_var))) %>% arrange(-n) %>% mutate(prop = round(-n*100/sum(n),1), lab.ypos = cumsum(prop) - 0.5*prop)
  split_by_type$label <- paste0(round(-split_by_type$prop), "%")

  textsize = (10/nrow(split_by_type)) + 1

  # Creating a pie chart
  ggplot(split_by_type,
       aes(x = 1,
           y = prop,
           fill = .data[[category_var]])) +
  geom_bar(width = 1,
           stat = "identity",
           color = "black") +
  geom_text(
    aes(label=label), position = position_stack(vjust=0.5),
            color = "black",
            size = textsize) +
  coord_polar("y",
              start = 0
              ) +
  theme_void() +
  labs(title = chart_title)

}
Sample function calls on couple of datasets
# Example usage on Cereals datasets
plot_pie_chart(cereal_df, "Type", "Cereals by Type")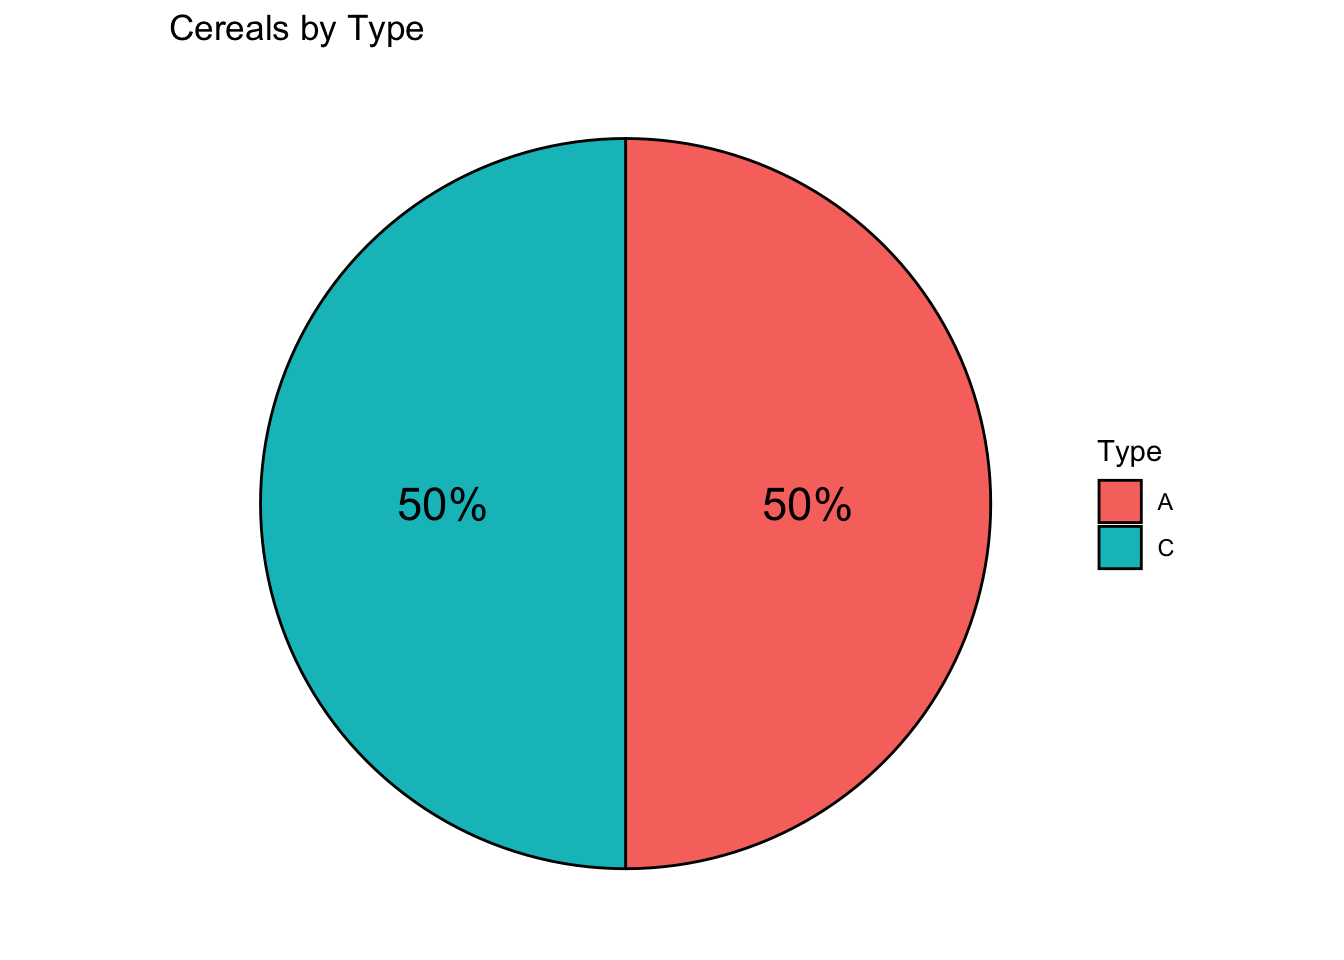
# Another example on abc poll data
abc_poll_2021 <- read_csv("_data/abc_poll_2021.csv")
abc_poll_2021 <- mutate(abc_poll_2021, is_hispanic = !str_detect(ppethm, "Non-Hispanic"), pprace = str_split(ppethm, ",", simplify = TRUE)[,1])
abc_poll_2021 <- mutate(abc_poll_2021, `Interview Consent` = case_when(str_detect(Contact, "Yes") ~ "Yes",
str_detect(Contact, "No") ~ "No"
))
abc_poll_2021 <- rename(abc_poll_2021, Race = pprace)# Function call to visualize the split of Poll respondents by their response to the "Interview consent" question
plot_pie_chart(abc_poll_2021, "Interview Consent", "Poll Respondents' consent to be interviewed")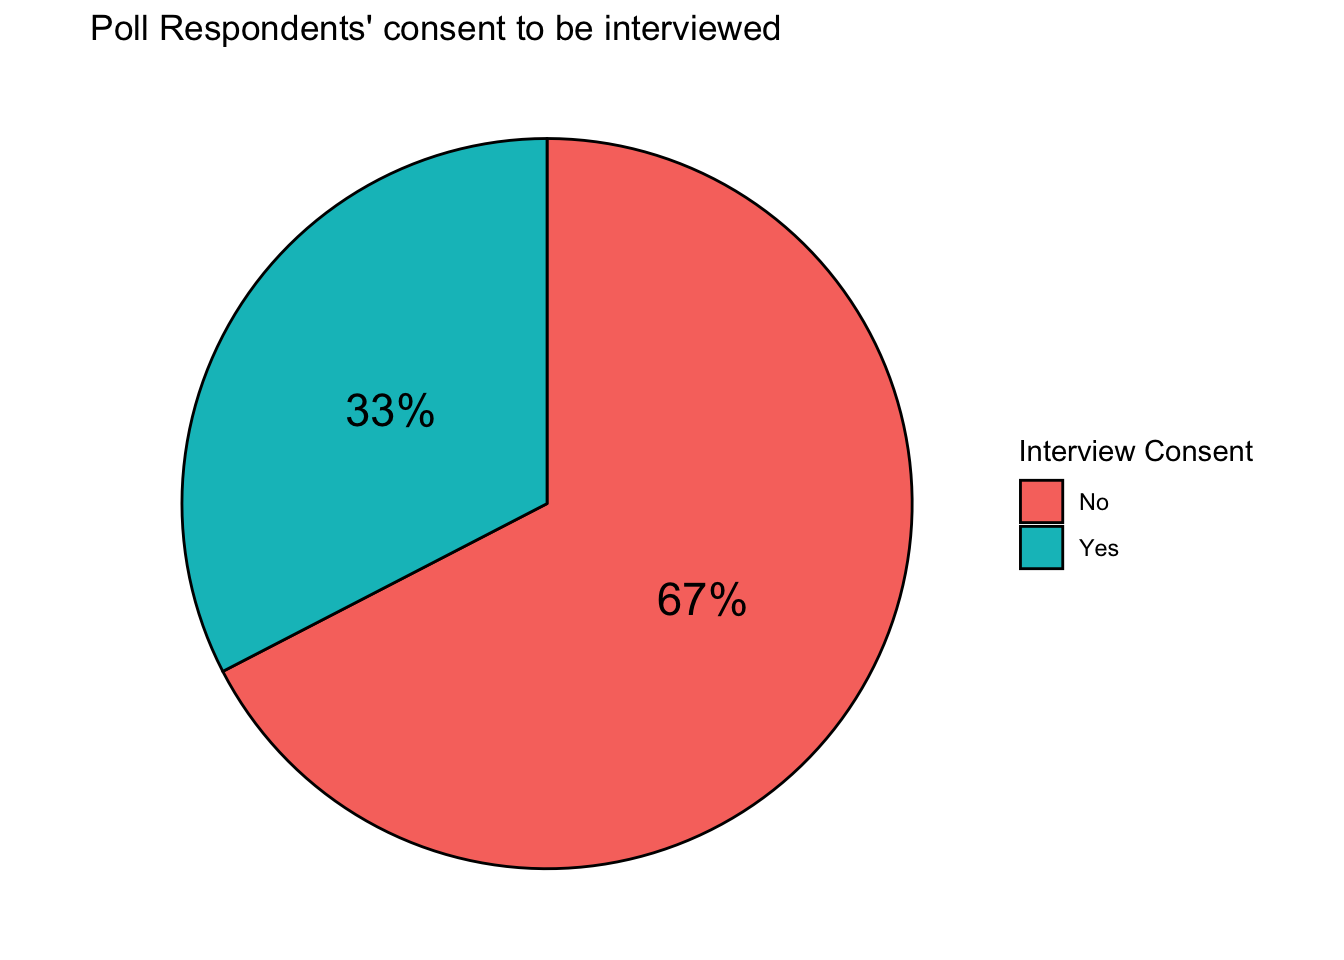
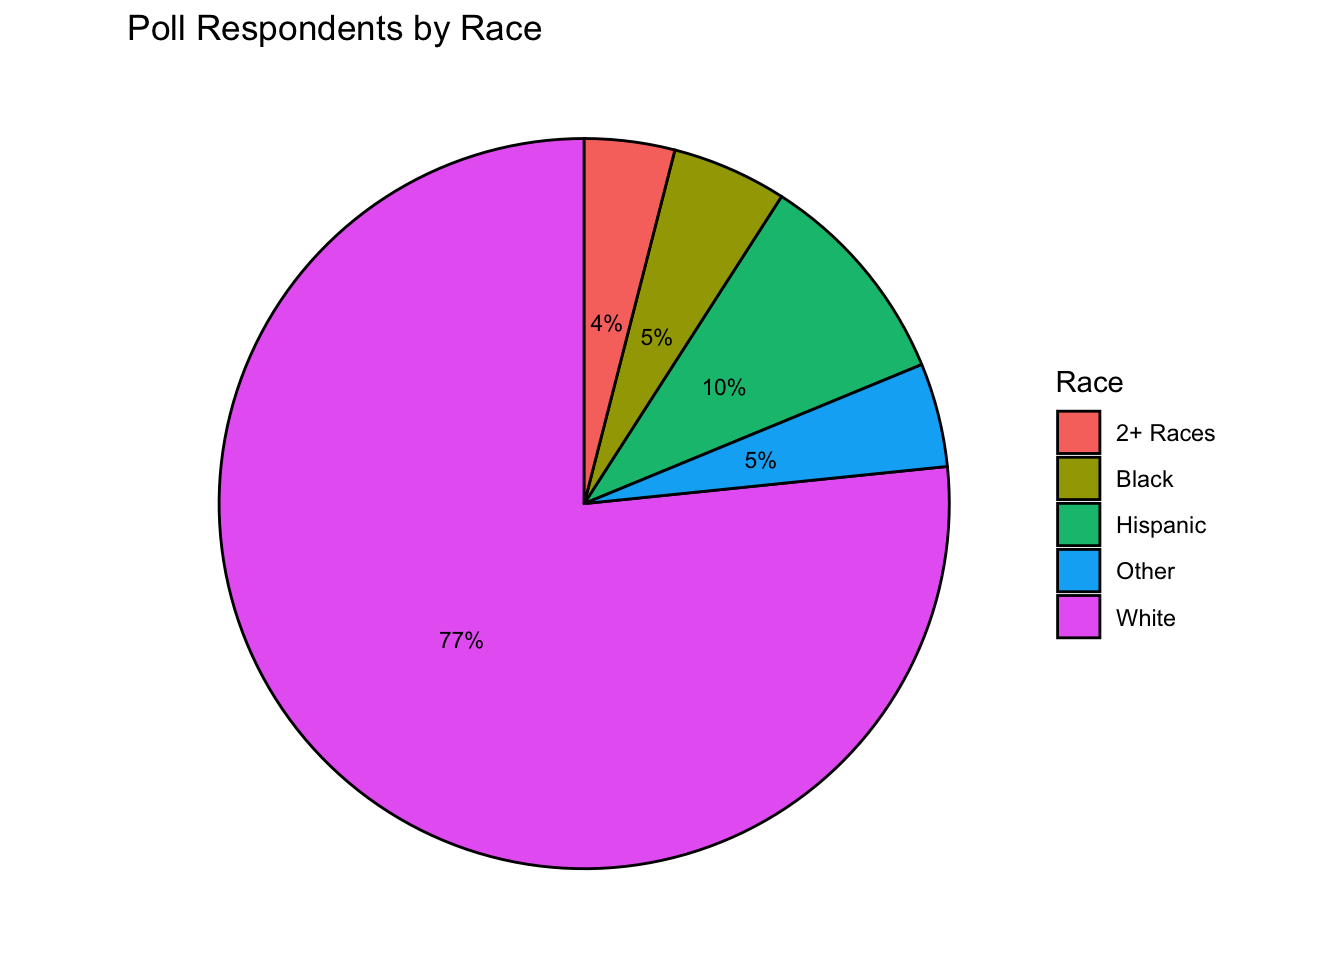
# Function call to visualize the split of Poll respondents by their race type
plot_pie_chart(abc_poll_2021, "Race", "Poll Respondents by Race")