Code
library(tidyverse)
library(ggplot2)
knitr::opts_chunk$set(echo = TRUE, warning=FALSE, message=FALSE)library(tidyverse)
library(ggplot2)
knitr::opts_chunk$set(echo = TRUE, warning=FALSE, message=FALSE)For this challenge, I will be using the hotel_bookings data set.
hotel_book <- readr::read_csv("_data/hotel_bookings.csv")
hotel_bookNumber of rows:
nrow(hotel_book)[1] 119390Number of columns:
ncol(hotel_book)[1] 32The data set encompasses various details about customers (such as the number of adults and children staying, customer type, previous bookings), reservation specifics (arrival date, duration of stay, room type), and hotel attributes (country location, distribution channel, hotel type). Each row in the dataset corresponds to a specific booking made at a specific hotel.
We’ll need to convert the existing arrival date columns in the data set into one arrival date column to tidy things up.
# convert arrival date columns into one arrival date column
hotel_book<-hotel_book %>%
mutate(date_arrive = str_c(arrival_date_day_of_month,
arrival_date_month,
arrival_date_year, sep="/"),
date_arrive = dmy(date_arrive))%>%
# remove old arrival date columns
select(-starts_with("arrival"))
hotel_bookNext, we’ll convert categorical variables from their current formats to factors.
# convert categorical variables to factors
categorical <- c('hotel', 'meal', 'country', 'market_segment', 'distribution_channel', 'reserved_room_type',
'assigned_room_type', 'deposit_type', 'customer_type', 'reservation_status')
hotel_book[categorical] <- lapply(hotel_book[categorical], factor)
# view sample of data to confirm factor status
head(hotel_book)We should also convert the variables is_canceled and is_repeated_guest to boolean from integers.
# convert 'is_canceled' and 'is_repeated_guest' to boolean from integers
hotel_book<-hotel_book %>%
mutate(is_canceled = as.logical(is_canceled), is_repeated_guest = as.logical(is_repeated_guest))
# view sample of data to confirm boolean status
head(hotel_book)Otherwise, the data is sufficiently tidy. However, let’s create an alternative version of the data set with booking grouped by month for easier analysis and visualization. We’ll separate out the month groupings by hotel type.
# group by month for resort hotels
month_resort <- hotel_book %>%
filter(hotel=="Resort Hotel") %>%
mutate(month=floor_date(date_arrive,unit="month")) %>%
group_by(month) %>%
summarise(amount=n(),type=hotel) %>%
ungroup()
# group by month for city hotels
month_city <- hotel_book %>%
filter(hotel=="City Hotel") %>%
mutate(month=floor_date(date_arrive,unit="month")) %>%
group_by(month) %>%
summarise(amount=n(),type=hotel) %>%
ungroup()
# combine resort and city hotels by month
month_hotel <- full_join(month_resort,month_city)
month_hotelFirst, let’s create a visualization of total bookings by month, broken out by hotel type. We’ll use a stacked area chart, which is good for viewing changes in a set of things (in this case types of hotel) where the cumulative value of all parts of the set is significant for analysis.
month_hotel %>%
ggplot(aes(x=month,y=amount,fill=type)) +
geom_area() +
scale_x_date(NULL, date_labels = "%b %y",breaks="2 months") +
scale_y_continuous(limits=c(0,7000)) +
labs(title="Bookings in Resort and City Hotels by Month",x="Month",y="Amount of bookings") +
theme(axis.text.x=element_text(angle=90))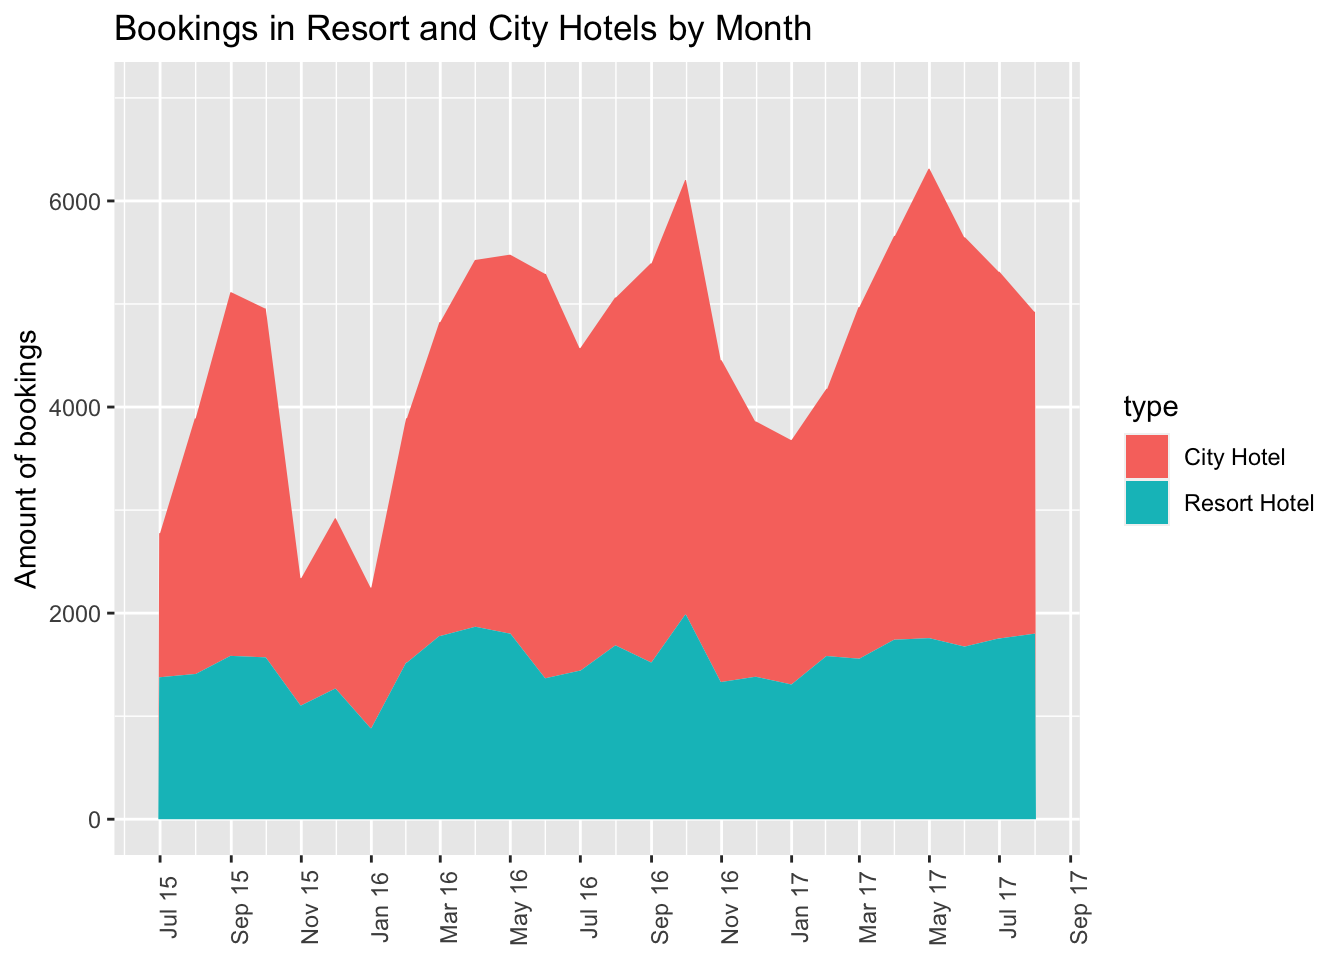
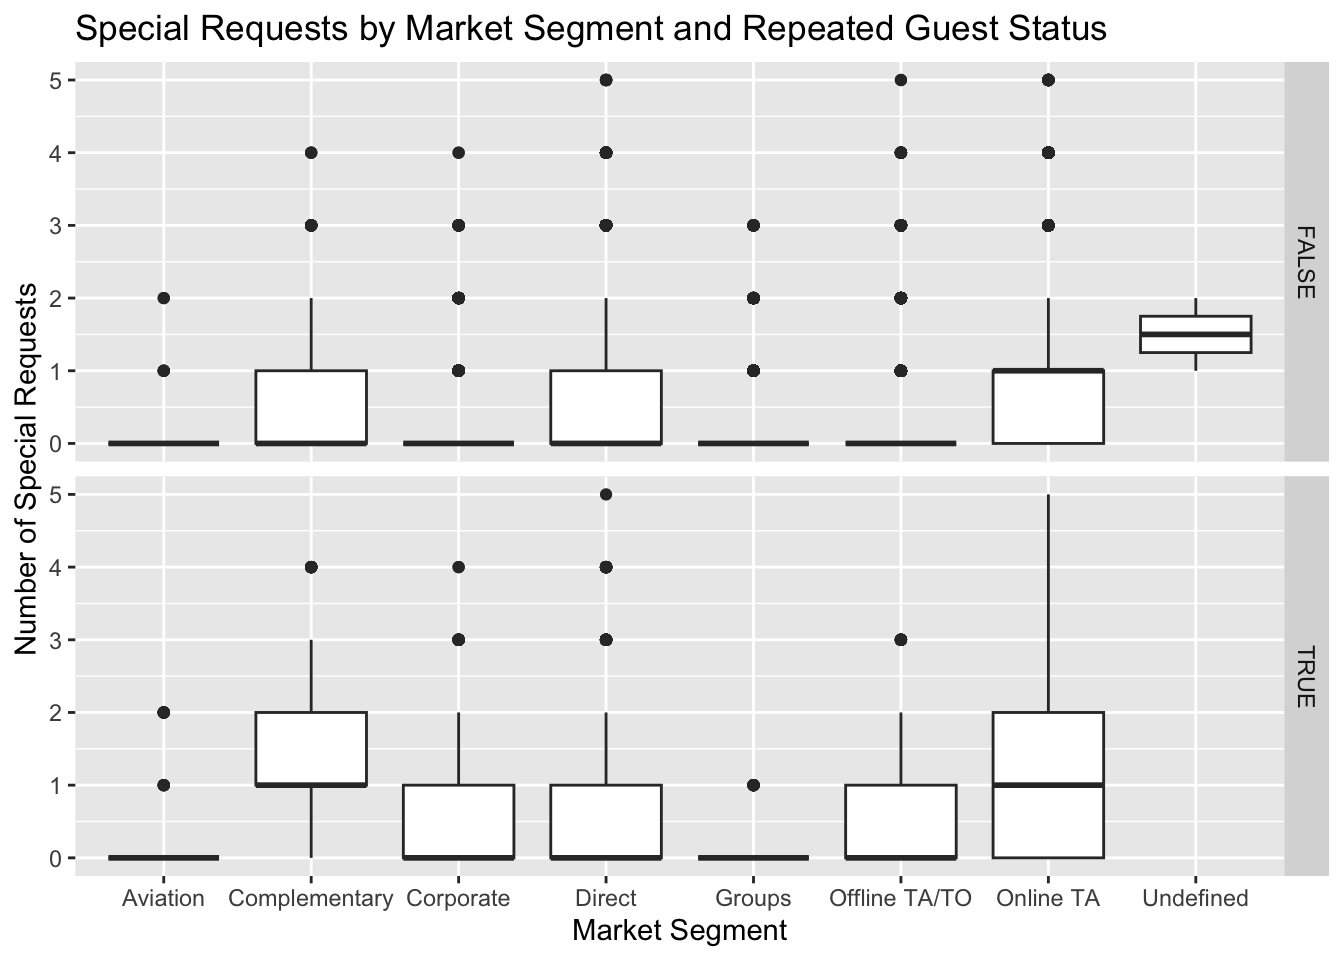
Next, we’ll create a boxplot looking at the distribution of special requests by customer market segment, broken out by whether the guest is a repeated guest. A boxplot is good for viewing distribution across a selected measure.
ggplot(hotel_book, aes(x=market_segment, y=total_of_special_requests)) +
geom_boxplot() +
facet_grid(is_repeated_guest ~ .) +
labs(title = "Special Requests by Market Segment and Repeated Guest Status",
x = "Market Segment",
y = "Number of Special Requests")