library(tidyverse)
library(ggplot2)

knitr::opts_chunk$set(echo = TRUE, warning=FALSE, message=FALSE)Challenge 9 Instructions
challenge_9
Creating a function
For this challenge, I have written a function to create a scatter plot.
# Function to plot a scatter plot
scatter <- function(data, x, y, title) {
  # Convert x and y to symbols
  x <- substitute(x)
  y <- substitute(y)

  # Create the scatter plot using ggplot2
  plot <- ggplot(data, aes(x = !!x, y = !!y)) +
    geom_point() +
    labs(title = title, x = deparse(x), y = deparse(y)) +
    theme_minimal()

  # Print the scatter plot
  print(plot)
}
We define a function called plot_scatter that takes four arguments: data, x, y, and title. The data argument represents the data frame containing the x and y variables, x and y are the column names of the variables to be plotted on the x and y axes, and title is the title of the scatter plot. Inside the function, we use the ggplot function to create the scatter plot. Finally, we print the scatter plot using the print function.
Example
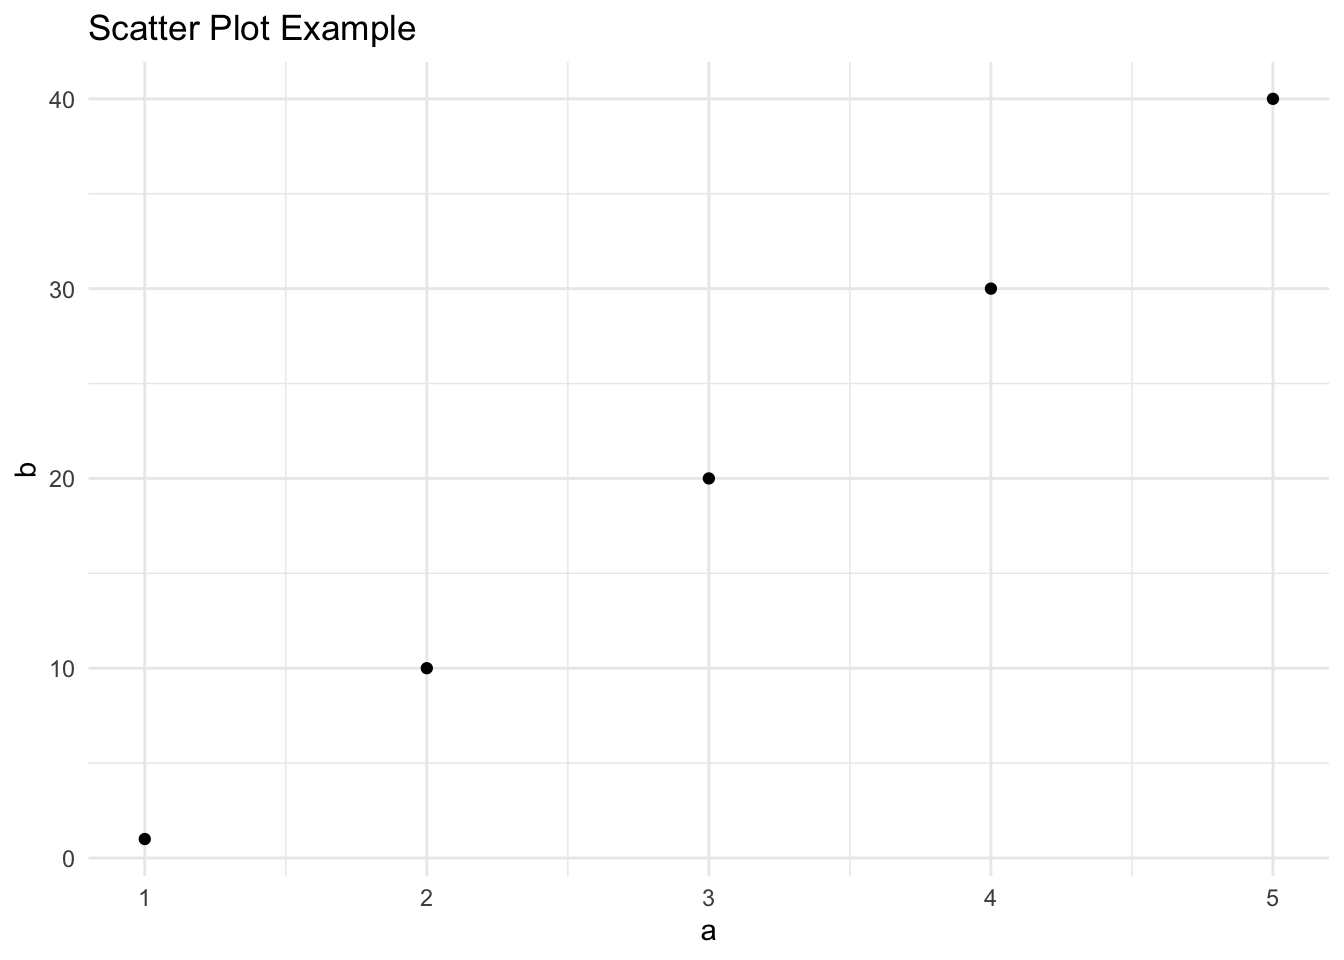
In the example below, we create a sample data frame with two columns (x and y) and call the plot_scatter function to generate the scatter plot with the specified column names and title.
# Example:
# Create a  data frame
sample <- data.frame(
  a = c(1, 2, 3, 4, 5),
  b = c(1, 10, 20, 30, 40)
)

# Call the function to plot the scatter plot
scatter(sample, a, b, "Scatter Plot Example")