Throughout historical and contemporary eras, hurricanes have remained as one of the most prevalent and destructive forms of natural disasters, especially for several coastal regions and communities with relative proximity above and below the Equator. Hurricanes are known by a handful of other names globally, including cyclones and typhoons–though the name may differ, baseline characteristics of the storm formation remain the same. As a Black woman born and raised in New Orleans, Louisiana–a city in the hurricane-prone region of the Gulf Coast of the United States–I feel as though it is imperative for championing learning in non-formal, multi-generational settings to be responsive to the drastic environmental changes that surround us. Robinson et al. (2022) detail, “A primary goal of environmental health policy should be to eliminate health disparities and the uneven burden that vulnerable populations feel from adverse outcomes…Environmental literacy, also known as ecological literacy or ecoliteracy, is an awareness about the environment and environmental problems, and the knowledge or methods to address those problems” (Robinson et al., 2022, pg. 348). With that said, data science and computational approaches have been used for decades to engage multi-dimensional studies of hurricanes. More can be done to ensure that such data is community-facing and accessible to marginalized populations within hurricane-prone areas and inclusive of their input and evaluation the data. In this project, I hope to use my embeddedness in a hurricane prone area and the skills I’ve gained in DACSS 601 to produce an analysis of a hurricane-related dataset as a small but worthwhile site of further building eco-literacy.
Reading in the Data
Code
# reading in the dataatlantic_hurricanes <-read_csv("_mysampledatasets/atlantic_hurricanes.csv")atlantic_hurricanes
Narrative About The Data
Code
summary(atlantic_hurricanes)
...1 Name Duration Wind speed
Min. : 0.0 Length:458 Length:458 Length:458
1st Qu.:114.2 Class :character Class :character Class :character
Median :228.5 Mode :character Mode :character Mode :character
Mean :228.5
3rd Qu.:342.8
Max. :457.0
Pressure Areas affected Deaths Damage
Length:458 Length:458 Length:458 Length:458
Class :character Class :character Class :character Class :character
Mode :character Mode :character Mode :character Mode :character
REf Category
Length:458 Min. :1.000
Class :character 1st Qu.:1.000
Mode :character Median :2.000
Mean :2.037
3rd Qu.:3.000
Max. :5.000
Code
dim(atlantic_hurricanes)
[1] 458 10
I sourced atlantic_hurricanes.csv from Kaggle, https://www.kaggle.com/datasets/valery2042/hurricanes, and do not currently have access to the original study it is affiliated (if there is one). The only information provided about sources on the dataset’s Kaggle page is, “I scraped Wikipedia pages of Atlantic hurricanes of Categoris 1,2,3 and 5 using pandas/html” (Liamtsau, 2022). With that said, it seems as though Liamtsau (2022) has collected the data and compiled it into a dataset but not engaged in a formal, ‘original’ study of it that can be located on Kaggle (Liamtsau, 2022).
This dataset provides insights into Atlantic hurricanes, hurricanes that developed in the Atlantic Ocean area, across a 100 year time period, from 1920 to 2020. This dataset lists hurricanes that fall under the Category 1, Category 2, Category 3, and Category 5 classifications; therefore, it doesn’t include Category 4 hurricanes nor does it include (storms that didn’t develop beyond) tropical storms and tropical depressions. 458 hurricanes or observations/rows are included in this dataset. There are 10 variables; at this stage, many of them read as character values even though some will need to be transformed into numeric, date, and time variables in forthcoming sections of this project. Variables in the original version of the data are:
…1 or X (or the list number/ID of the hurricane as entered into the dataset, mostly used for organizational, data entry purposes–numeric value)
the name of the hurricane (character value),
the duration of the hurricane/the dates that it occurred (character value),
the wind speed of the hurricane (in miles per hour and kilometers per hour) (character value),
the pressure of the hurricane (in atmospheric pressure-hPa and in inch of mercury-inHg) (character value),
the number of deaths caused by the hurricane (character value),
the amount of damage in US dollars caused by the hurricane (character value),
the category of the hurricane (Cat 1, 2, 3, or 5) (numeric value),
the numerically assigned references/footnotes that provide further information about the hurricane (character value)
Research Questions for Data Visualization and Analysis
My initial exploration of the dataset has produced the following questions that I’d like to analyse more in depth in the data visualization section after the data cleaning process:
Research Question 1: Does a hurricane’s max wind speed (mph) have any correlation with its max pressure measure (hPa)?
Research Question 2: Is the max wind speed measure a determining factor of hurricane category classification?
Research Question 3: Are hurricanes getting more expensive? Is the dollar unit of damage costs per hurricane rising over the years?
Research Question 4: Is there a relationship between number of deaths and a hurricane’s damage cost(adjusted to millions USD)? Do hurricanes of higher categories cause more deaths? Do hurricanes of higher categories have higher damage costs?
Research Question 5: Do hurricanes with a higher max Category have a longer duration (in days)? Do hurricanes of higher categories cause more deaths? Do hurricanes of higher categories have higher damage costs?
Research Question 6: Which areas listed in the Land.areas.affected column are susceptible to the most hurricanes?
Data Cleaning Part 1
1. Removing REf Column and the …1 or X Column
I am removing the REf column because I am unclear on what it represents, and I do not believe it will be useful for my purposes in tidying and working towards analyzing the snapshot this dataset provides into Atlantic hurricanes more broadly. I believe REf is potentially referring to listed/numbered footnote references from the Wikipedia pages (Liamtsau, 2022). I am removing the ..1/X column as well because this is simply the list/ID number of each hurricane as it is entered into the dataset, and since R Studio maintains its own list/ID number on the far left of the table I believe the X variable is no longer necessary. Also, since the first number in the X column is 0 for the first hurricane listed instead of 1, this can be confusing for some readers whose numbering convention starts with 1. Scrolling all the way to the end of the table (page 46 for me), we can see that the last value listed in the X column is 457, which is a slight mismatch from the 458 rows/observation values, which represented the total number of hurricanes included in the study, that R computed the dataset to have.
Code
# remove column named REf and the X Columnatlantic_hurricanes2 <- atlantic_hurricanes %>%select(-c(...1,REf))atlantic_hurricanes2
Looks like the REf and X (or …1) columns were successfully removed! There should now be 8 columns.
2. Separate Wind.speed into Wind.speed.mph and Wind.speed.kmh and Pressure into Pressure.hPa and Pressure.inHg
In the current version of the dataset, within the Wind.speed column, values for each hurricane’s wind speed are provided in miles per hour (mph) and kilometers per hour (km/h) in the same cell. Likewise, values for each hurricane’s pressure are provided in hPa (atmospheric pressure) and inHg (inch of Mercury). I would like to separate those values, so each unit of measurement for the wind speed and pressure, respectively has their own distinct columns.
Code
# separate the Wind.speed column into Wind.speed.mph and Wind.speed.kmhatlantic_hurricanes3 <-separate(atlantic_hurricanes2, `Wind speed`, into =c("Wind.speed.mph", "Wind.speed.kmh"), sep ="\\(")atlantic_hurricanes3
Code
# separate Pressure column into Pressure.hPa and Pressure.inHgatlantic_hurricanes4 <-separate(atlantic_hurricanes3, Pressure, into =c("Pressure.hPa", "Pressure.inHg"), sep =" ")atlantic_hurricanes4
Looks like each unit of measurement for a hurricane’s wind speed (Wind.speed.mph and Wind.speed.kmh) and a hurricane’s pressure (Pressure.hPa and Pressure.inHg) now have their own distinct columns!
3. Removing measurement unit abbreviations and unneeded parentheses from values in the Wind.speed.mph, Wind.speed.kmh, Pressure.hPa, and Pressure.inHg columns
I would like to remove the measurement unit abbreviations and unneeded parentheses from values in the Wind.speed.mph, Wind.speed.kmh, Pressure.hPa, and Pressure.inHg columns so that only the numbers/numeric values remain. Once R reads these columns as have numeric values, I’ll be able to run summary statistics and other relevant numeric related functions using them that’ll provide useful information to analyze.
Code
# removing "mph" from the end of values in the Wind.speed.mph columnatlantic_hurricanes5 <-mutate(atlantic_hurricanes4, Wind.speed.mph =as.numeric(str_extract(Wind.speed.mph,pattern="[:digit:]+")))atlantic_hurricanes5
Looks like “mph” has been removed from the end of Wind.speed.mph values!
Code
# removing "km/h)" from the end of values in the Wind.speed.kmh columnatlantic_hurricanes6 <-mutate(atlantic_hurricanes5, Wind.speed.kmh =as.numeric(str_extract(Wind.speed.kmh,pattern ="[:digit:]+")))atlantic_hurricanes6
Looks like “km/h)” has been successufully removed from the end of Wind.speed.kmh values!
Code
# removing commas from values in Pressure.hPa# removing "hPa" from the end of values in the Pressure.hPa columnatlantic_hurricanes7<-mutate(atlantic_hurricanes6, Pressure.hPa =str_remove(Pressure.hPa, ","),Pressure.hPa=as.numeric(str_extract(Pressure.hPa,pattern ="[:digit:]+")))atlantic_hurricanes7
Looks like commas and the hPa abbreviation have been successfully removed from the Pressure.hPa values!
Tidying the Areas column
Code
#changing areas column into areas affectedn_areas_max <-max(str_count(atlantic_hurricanes7[!is.na(atlantic_hurricanes7$`Areas affected`),]$`Areas affected`, "[a-z],"))+2#separate areas affected into multiple columns then pivot longer into one column, called areaatlantic_hurricanes8 <- atlantic_hurricanes7 %>%separate(`Areas affected`, into =paste0("a",1:n_areas_max), sep =",") %>%pivot_longer(c(a1,a2,a3,a4,a5,a6,a7,a8,a9,a10,a11),names_to ="del", values_to="area") %>%select(-del)%>%filter(!is.na(area))atlantic_hurricanes8
Code
# creating csv file of most-current version of the dataset to read into Google Sheets to make small editswrite_csv(atlantic_hurricanes8, "atlantic_hurricanes8.csv")
Looks like the areas affected column has been successfully pivoted longer into the area column where each area should have its own distinct cell! In addition, looks like we’ve also been able to use the write_csv() function to create a csv file of the most current version of the dataset up to this point (working with the atlantic_hurricanes8 data table). This will be imported into Google Sheets so that minor formatting changes to remove special characters and to separate two or more affected areas that previously did not have spaces in between them more succinctly than I know how to do so in R!
Reading Back in the Data Set after manually changing small things in Google Sheets
I made a few minor changes to the atlantic_hurricanes8 dataset in Google Sheets such as removing cross signs (a special character) from the end of some duration dates, changing the dashes in the duration column from double dash (–, a special character) to a single dash (-), duplicating rows to separate two or more different affected areas that previously were not listed with spaces between them and changing the name of the Category column to Max.category.
Code
# reading back in data set after manually changing some small things in Google Sheetsatlantic_hurricanes9 <-read_csv("_mysampledatasets/atlantic_hurricanes8_GoogleSheetsVersion.csv")atlantic_hurricanes9
Looks like we’ve successfully read back in the dataset after making some small formatting adjustments in Google Sheets!
Data Cleaning Part 2
Removing Wind.speed.kmh and Pressure.inHg columns, extracting Start_Date from the Duration column and renaming Wind.speed.mph to Max.wind.speed.mph and Pressure.hPa into Max.pressure.hPa
Code
# Deleting Wind.speed.kmh and Pressure.inHg columns so that there's only one measure for wind speed (mph) and one measure for pressure (hPa)atlantic_hurricanes10 <- atlantic_hurricanes9 %>%select(-c(Wind.speed.kmh, Pressure.inHg))atlantic_hurricanes10
Code
# Extracting Start_Date from the Duration columnatlantic_hurricanes11 <- atlantic_hurricanes10 %>%mutate(Start_Date=str_c(str_extract(Duration,"[:alpha:]+ [:digit:]+(?=,)"),str_extract(Duration,", [:digit:]+")))atlantic_hurricanes11
Code
# renaming Wind.speed.mph to Max.wind.speed.mph and Pressure.hPa to Max.pressure.hPaatlantic_hurricanes12 <- atlantic_hurricanes11 %>%rename(Max.wind.speed.mph=Wind.speed.mph)%>%rename(Max.pressure.hPa=Pressure.hPa)atlantic_hurricanes12
Looks like Wind.speed.kmh and Pressure.inHg were removed successfully!
Tidying the Deaths column: changing “None” values to 0 and “Unknown” values to NA and changing Deaths column to read as a numeric value
Code
# change values that read in Deaths column as "None" to the number 0atlantic_hurricanes12$Deaths <-str_replace(atlantic_hurricanes12$Deaths, "None", "0")atlantic_hurricanes12
Code
# change values in Deaths column that read as "Unknown" to NAatlantic_hurricanes12$Deaths <-na_if(atlantic_hurricanes12$Deaths, "Unknown")atlantic_hurricanes12
Code
# change values in Deaths column that contain >1,000 to NAatlantic_hurricanes12$Deaths <-na_if(atlantic_hurricanes12$Deaths, ">1,000")atlantic_hurricanes12
Code
# change Deaths column to read as a numeric variableatlantic_hurricanes13 <-transform(atlantic_hurricanes12, Deaths =as.numeric(Deaths))atlantic_hurricanes13
As expected, looks like the Deaths column now reads as a numeric variable and the “None” value has been switched to 0 and the “Unknown” value has been switched to NA!
Tidying the Damage column
Currently, there are a handful of values in the Damage column that will not make for the clearest analysis. All of the values contained in the Damage column can be seen when running the unique () function, which I will do below. I will change values that do not make for the clearest analysis/are less straightforward to NA. I will also remove the dollar signs, assuming that the creator of this dataset used USD for all monetary values. This is part of the process of having Damage eventually read as a numeric variable–so I can compute summary statistics and do visualizations off of the dollar amount. Like the Deaths column, there is also a value in the Damage column called “None” but instead of changing that to 0 I will be changing that to NA because I find it hard to believe that a hurricane (even of a lower intensity) caused zero damage (as a qualitative descriptor) and/or $0 worth of damage as a more quantitative descriptor.
Code
# checking for all unique values in the Damage columnunique(atlantic_hurricanes13$Damage)
Looks like all of the less clear/less straightforward values in the Damage column have been removed!
Code
# separating Damage into Damage.amount and Damage.unitatlantic_hurricanes15 <- atlantic_hurricanes14%>%separate(Damage, c("Damage.$.amount", "Damage.$.unit"), " ")atlantic_hurricanes15
Code
# removing $ dollar sign from Damage.$.amount column, making Damage.$.amount column a numeric variableatlantic_hurricanes15$`Damage.$.amount`=as.numeric(gsub("\\$", "", atlantic_hurricanes15$`Damage.$.amount`))atlantic_hurricanes15
Looks like the Damage column has been separated into two different columns, and the Damage.$.amount column is now a numeric variable!
Revisiting/Further Cleaning the area column
I’d like to change “No land areas” and “None” values within the area column to NA; with that said, in order to make that change, I think it’s fitting to rename the area column to Land.areas.affected, so NA in that case could mean the land areas affected were/are unknown or there were no land areas affected, as in the hurricane system only remained in open waters and did not formally make landfall at any land-based location/territory.
Code
# Renaming area to Land.areas.affectedatlantic_hurricanes16 <- atlantic_hurricanes15 %>%rename(Land.areas.affected=area)atlantic_hurricanes16
Code
# viewing all unique values in Land.areas.affectedunique(atlantic_hurricanes16$Land.areas.affected)
[1] "Central America" "Gulf of Mexico"
[3] "Mexico" "None"
[5] "Newfoundland" "Gulf Coast of the United States"
[7] "United States East Coast" "Cuba"
[9] "The Bahamas" "Cape Verde"
[11] "Windward Islands" "Leeward Islands"
[13] "United States Gulf Coast" "Azores"
[15] "Bermuda" "Newfoundland and Labrador"
[17] "Jamaica" "Haiti"
[19] "Texas" "Yucatán Peninsula"
[21] "Tamaulipas" "Veracruz"
[23] "Puerto Rico" "Turks and Caicos Islands"
[25] "Eastern United States" "Honduras"
[27] "The Caribbean" "Nicaragua"
[29] "North Carolina" "Mid-Atlantic States"
[31] "Belize" "Guatemala"
[33] "Louisiana" "Mississippi"
[35] "Midwestern United States" "Saint Croix"
[37] "Dominican Republic" "Georgia"
[39] "Southwestern Florida" "Florida"
[41] "Bahamas" "South Carolina"
[43] "Virginia" "Martinique"
[45] "Saint Lucia" "Hispaniola"
[47] "Atlantic Canada" "Virgin Islands"
[49] "Sable Island" "Saba"
[51] "Anguilla" "Lesser Antilles"
[53] "Western Mexico" "Alabama"
[55] "The Carolinas" "New England"
[57] "Canadian Maritime Provinces" "Oklahoma"
[59] "Leeward Antilles" "Greater Antilles"
[61] "Northeastern United States" "Nova Scotia"
[63] "Ireland" "United Kingdom"
[65] "Norway" "Soviet Union"
[67] "British Isles" "Quebec"
[69] "Panama" "Costa Rica"
[71] "Cayman Islands" "Southeastern United States"
[73] "northern Mexico" "western Cuba"
[75] "Florida Panhandle" "Maryland"
[77] "Pennsylvania" "New York"
[79] "Maine" "Tennessee"
[81] "North Carolina and Virginia" "St. Lucia"
[83] "Barbados" "Grenada"
[85] "central United States" "Canada"
[87] "Eastern Canada" "Iberian Peninsula"
[89] "Trinidad and Tobago" "Venezuela"
[91] "Colombia" "Socorro Island"
[93] "El Salvador" "Northern Mexico"
[95] "Southern Texas" "Delaware"
[97] "Massachusetts" "Scotland"
[99] "Eastern Coast of the United States" "Europe"
[101] "Madeira Islands" "Southern Portugal"
[103] "Southwestern Spain" "Iceland"
[105] "Greenland" "Central Mexico"
[107] "Western Europe" "Tabasco"
[109] "Guadeloupe" "Montserrat"
[111] "Saint Thomas" "Trinidad"
[113] "Quintana Roo" "Tampico"
[115] "Chiapas" "Arkansas"
[117] "Campeche" "New Jersey"
[119] "Dominica" "Spain"
[121] "France" "Antigua"
[123] "Barbuda" "South Central United States"
[125] "Lucayan Archipelago" "West Africa"
[127] "Faroe Islands" "East Coast of the United States"
[129] "No land areas" "Central United States"
[131] "Northern Europe" "Turks and Caicos"
[133] "Yucatán peninsula" "No Land Areas"
[135] "United States Virgin Islands" "Northeastern Caribbean"
[137] "West Virginia" "Great Britain"
[139] "Southeast Mexico" "Cape Verde Islands"
[141] "Antilles" "Portugal"
[143] "Mid-Atlantic" "Southwestern Quebec"
[145] "United States East coast" "South Texas"
[147] "South Florida" "Ontario"
[149] "Cabo Verde"
Code
# changing "None" and "No land areas" and "No Land Areas" to NAatlantic_hurricanes16$Land.areas.affected[startsWith(atlantic_hurricanes16$Land.areas.affected, "None")] <-NAatlantic_hurricanes16$Land.areas.affected[startsWith(atlantic_hurricanes16$Land.areas.affected, "No land areas")] <-NAatlantic_hurricanes16$Land.areas.affected[startsWith(atlantic_hurricanes16$Land.areas.affected, "No Land Areas")] <-NA#re-checking for NA in Land.areas.affected columnatlantic_hurricanes17 <- atlantic_hurricanes16atlantic_hurricanes17
Code
unique(atlantic_hurricanes17$Land.areas.affected)
[1] "Central America" "Gulf of Mexico"
[3] "Mexico" NA
[5] "Newfoundland" "Gulf Coast of the United States"
[7] "United States East Coast" "Cuba"
[9] "The Bahamas" "Cape Verde"
[11] "Windward Islands" "Leeward Islands"
[13] "United States Gulf Coast" "Azores"
[15] "Bermuda" "Newfoundland and Labrador"
[17] "Jamaica" "Haiti"
[19] "Texas" "Yucatán Peninsula"
[21] "Tamaulipas" "Veracruz"
[23] "Puerto Rico" "Turks and Caicos Islands"
[25] "Eastern United States" "Honduras"
[27] "The Caribbean" "Nicaragua"
[29] "North Carolina" "Mid-Atlantic States"
[31] "Belize" "Guatemala"
[33] "Louisiana" "Mississippi"
[35] "Midwestern United States" "Saint Croix"
[37] "Dominican Republic" "Georgia"
[39] "Southwestern Florida" "Florida"
[41] "Bahamas" "South Carolina"
[43] "Virginia" "Martinique"
[45] "Saint Lucia" "Hispaniola"
[47] "Atlantic Canada" "Virgin Islands"
[49] "Sable Island" "Saba"
[51] "Anguilla" "Lesser Antilles"
[53] "Western Mexico" "Alabama"
[55] "The Carolinas" "New England"
[57] "Canadian Maritime Provinces" "Oklahoma"
[59] "Leeward Antilles" "Greater Antilles"
[61] "Northeastern United States" "Nova Scotia"
[63] "Ireland" "United Kingdom"
[65] "Norway" "Soviet Union"
[67] "British Isles" "Quebec"
[69] "Panama" "Costa Rica"
[71] "Cayman Islands" "Southeastern United States"
[73] "northern Mexico" "western Cuba"
[75] "Florida Panhandle" "Maryland"
[77] "Pennsylvania" "New York"
[79] "Maine" "Tennessee"
[81] "North Carolina and Virginia" "St. Lucia"
[83] "Barbados" "Grenada"
[85] "central United States" "Canada"
[87] "Eastern Canada" "Iberian Peninsula"
[89] "Trinidad and Tobago" "Venezuela"
[91] "Colombia" "Socorro Island"
[93] "El Salvador" "Northern Mexico"
[95] "Southern Texas" "Delaware"
[97] "Massachusetts" "Scotland"
[99] "Eastern Coast of the United States" "Europe"
[101] "Madeira Islands" "Southern Portugal"
[103] "Southwestern Spain" "Iceland"
[105] "Greenland" "Central Mexico"
[107] "Western Europe" "Tabasco"
[109] "Guadeloupe" "Montserrat"
[111] "Saint Thomas" "Trinidad"
[113] "Quintana Roo" "Tampico"
[115] "Chiapas" "Arkansas"
[117] "Campeche" "New Jersey"
[119] "Dominica" "Spain"
[121] "France" "Antigua"
[123] "Barbuda" "South Central United States"
[125] "Lucayan Archipelago" "West Africa"
[127] "Faroe Islands" "East Coast of the United States"
[129] "Central United States" "Northern Europe"
[131] "Turks and Caicos" "Yucatán peninsula"
[133] "United States Virgin Islands" "Northeastern Caribbean"
[135] "West Virginia" "Great Britain"
[137] "Southeast Mexico" "Cape Verde Islands"
[139] "Antilles" "Portugal"
[141] "Mid-Atlantic" "Southwestern Quebec"
[143] "United States East coast" "South Texas"
[145] "South Florida" "Ontario"
[147] "Cabo Verde"
Looks like modifications to the Land.areas.affected column were made successfully as expected!
Summary Statistics
summary stats about Max.wind.speed.mph
Code
# summary stats about Max.wind.speed.mphsummary(atlantic_hurricanes17$Max.wind.speed.mph)
Min. 1st Qu. Median Mean 3rd Qu. Max.
75.0 85.0 100.0 104.9 115.0 190.0
summary stats about Max.pressure.hPa
Code
#summary stats about Max.pressure.hPasummary(atlantic_hurricanes17$Max.pressure.hPa)
Min. 1st Qu. Median Mean 3rd Qu. Max. NA's
882.0 960.0 975.0 968.8 985.0 1007.0 8
summary stats about Deaths
Code
#summary stats about Deathssummary(atlantic_hurricanes17$Deaths)
Min. 1st Qu. Median Mean 3rd Qu. Max. NA's
0.0 0.0 5.0 224.7 27.0 19325.0 81
summary stats about Land.areas.affected
Code
# summary stats about total number of distinct land areas affectedatlantic_hurricanes17%>%summarise(count =n_distinct(Land.areas.affected))
Code
# summary of how many times each land area was featuredtable(atlantic_hurricanes17$Land.areas.affected)
Alabama Anguilla
8 2
Antigua Antilles
1 2
Arkansas Atlantic Canada
1 37
Azores Bahamas
23 24
Barbados Barbuda
1 1
Belize Bermuda
12 57
British Isles Cabo Verde
4 1
Campeche Canada
1 5
Canadian Maritime Provinces Cape Verde
1 8
Cape Verde Islands Cayman Islands
1 7
Central America Central Mexico
26 2
central United States Central United States
1 1
Chiapas Colombia
1 4
Costa Rica Cuba
3 49
Delaware Dominica
1 2
Dominican Republic East Coast of the United States
6 16
Eastern Canada Eastern Coast of the United States
3 1
Eastern United States El Salvador
6 2
Europe Faroe Islands
1 1
Florida Florida Panhandle
53 1
France Georgia
1 12
Great Britain Greater Antilles
1 13
Greenland Grenada
3 1
Guadeloupe Guatemala
4 9
Gulf Coast of the United States Gulf of Mexico
7 3
Haiti Hispaniola
4 17
Honduras Iberian Peninsula
8 2
Iceland Ireland
4 3
Jamaica Leeward Antilles
22 4
Leeward Islands Lesser Antilles
16 19
Louisiana Lucayan Archipelago
19 1
Madeira Islands Maine
1 1
Martinique Maryland
2 3
Massachusetts Mexico
1 40
Mid-Atlantic Mid-Atlantic States
1 8
Midwestern United States Mississippi
4 9
Montserrat New England
2 10
New Jersey New York
3 3
Newfoundland Newfoundland and Labrador
24 1
Nicaragua North Carolina
7 22
North Carolina and Virginia Northeastern Caribbean
1 1
Northeastern United States Northern Europe
3 1
northern Mexico Northern Mexico
1 1
Norway Nova Scotia
3 15
Oklahoma Ontario
2 1
Panama Pennsylvania
3 3
Portugal Puerto Rico
1 28
Quebec Quintana Roo
2 2
Saba Sable Island
1 2
Saint Croix Saint Lucia
1 1
Saint Thomas Scotland
1 1
Socorro Island South Carolina
1 8
South Central United States South Florida
1 1
South Texas Southeast Mexico
1 1
Southeastern United States Southern Portugal
9 1
Southern Texas Southwestern Florida
1 1
Southwestern Quebec Southwestern Spain
1 1
Soviet Union Spain
1 2
St. Lucia Tabasco
1 2
Tamaulipas Tampico
4 1
Tennessee Texas
3 25
The Bahamas The Caribbean
31 11
The Carolinas Trinidad
12 1
Trinidad and Tobago Turks and Caicos
2 1
Turks and Caicos Islands United Kingdom
9 4
United States East coast United States East Coast
1 32
United States Gulf Coast United States Virgin Islands
18 1
Venezuela Veracruz
6 4
Virgin Islands Virginia
3 11
West Africa West Virginia
1 1
western Cuba Western Europe
2 2
Western Mexico Windward Islands
2 13
Yucatán peninsula Yucatán Peninsula
1 23
summary stats about Max.category
Code
# summary stats about total number of distinct Max categories featuredatlantic_hurricanes17%>%summarize(count =n_distinct(Max.category))
Code
# summary stats about how many times each distinct Max category is featuredtable(atlantic_hurricanes17$Max.category)
1 2 3 5
489 291 216 117
summary stats about Name
Code
#summary stats about total number of distinct hurricane names featuredatlantic_hurricanes17%>%summarize(count =n_distinct(Name))
Code
#summary stats about how many times each hurricane name was featured-->there are repeats because of how we pivoted land areas affected earlier but also hurricane names are periodically recycledtable(atlantic_hurricanes17$Name)
"Bahamas" "Camagüey"
2 6
"Cuba-Brownsville" "Cuba"
5 5
"Labor Day" "New England"
5 2
"San Felipe IIOkeechobee" "Tampico"
4 2
1928 Haiti hurricane 1932 Florida-Alabama hurricane
3 1
1933 Florida-Mexico hurricane 1935 Jérémie hurricane
3 4
1991 Perfect Storm Abby
3 14
Able Agnes
13 10
Alberto Alex
3 5
Alice Alicia
6 1
Allen Allison
4 6
Alma Andrew
9 3
Anita Anna
1 7
Arlene Arthur
5 3
Audrey Babe
2 8
Baker Barbara
6 2
Barry Becky
3 2
Belle Bertha
1 9
Beta Beth
1 4
Betsy Betty
3 1
Beulah Bill
4 1
Blanche Bob
3 7
Bonnie Brenda
8 3
Camille Candice
2 1
Carol Caroline
6 3
Celia Cesar
2 10
Chantal Charley
5 4
Charlie Chloe
5 3
Chris Cindy
3 9
Clara Claudette
2 7
Cleo Cora
4 4
Daisy Danielle
4 5
Danny David
12 2
Dawn Dean
1 6
Debbie Debby
7 7
Debra Dennis
5 10
Diana Diane
1 5
Dog Dolly
4 14
Doria Dorian
1 5
Doris Dorothy
1 3
Earl Easy
4 3
Edith Edna
10 3
Edouard Eight
1 7
Eighteen Elena
5 3
Eleven Ella
13 11
Ellen Eloise
1 5
Emily Emmy
10 2
Epsilon Erika
2 6
Erin Ernesto
7 10
Escuminac (Three) Esther
2 1
Ethel Evelyn
2 3
Faith Faye
2 1
Felix Fern
4 5
Fifi Fifteen
5 3
Five Flora
12 2
Florence Flossie
16 1
Flossy Floyd
9 6
Four Fox
22 5
Fran Francelia
6 1
Frances Fred
5 1
Frieda Gabrielle
2 2
Gail Gaston
1 6
George Georges
1 1
Gerda Gert
2 5
Gertrude Gilbert
1 5
Ginger Ginny
2 6
Gladys Gloria
6 2
Gordon Grace
19 5
Greta Gustav
4 4
Hanna Hannah
6 1
Harvey Hattie
1 1
Hazel Heidi
2 1
Helene Henri
4 2
Hilda Holly
2 2
Hortense How
1 2
Hugo Humberto
2 12
Ida Ilsa
4 1
Inez Inga
3 1
Irene Iris
13 3
Irma Isaac
5 1
Isabel Isbell
4 2
Isidore Item
5 2
Ivan Janet
5 2
Janice Jeanne
3 8
Jenny Jerry
2 3
Jig Jose
3 2
Josephine Joyce
2 3
Juan Judith
4 1
Kara Karen
1 3
Karl Kate
4 3
Katia Katie
1 7
Katrina Kendra
7 2
King Kirk
3 1
Klaus Kyle
8 10
Larry Laurie
2 1
Lee Lili
1 12
Lisa Lois
2 1
Lorenzo Love
4 4
Marco Maria
5 8
Marilyn Martha
5 2
Matthew Michael
5 6
Mitch Nana
3 1
Nate Nicole
4 1
Nine Nineteen
4 1
Noel Olga
9 4
One Ophelia
20 9
Oscar Otto
1 3
Paula Paulette
6 1
Philippe Richard
1 4
Rina Rita
2 2
Roxanne Sally
3 3
San Pedro Sandy
2 3
Seven Seventeen
11 1
Six Stan
10 7
Tanya Ten
1 12
Thirteen Three
8 13
Tomas Twelve
4 2
Two Unnamed
21 35
Vince Wilma
3 3
Zeta
8
summary stats about Damage.$.units
Code
# summary stats number of distinct Damage.$.unitsatlantic_hurricanes17%>%summarise(count =n_distinct(`Damage.$.unit`))
Code
# summary stats of each Damage.$.units featured-->should show that most of the hurricanes cost in the millions rangetable(atlantic_hurricanes17$`Damage.$.unit`)
billion million thousand
97 351 95
Data Cleaning Part 3
Removing the 1st Attempt of the Start_Date Column
In the midst this project, I found that the date(s) listed within this first attempt of a Start_Date column were actually the end dates of the hurricanes. With that said, we found an alternate way to tidy and re-purpose information from the Duration column in the forthcoming step, so we no longer have need for this Start_Date column
Code
#Removing the 1st attempt of the Start_Date columnatlantic_hurricanes17_1<-atlantic_hurricanes17%>%select(-c(Start_Date))atlantic_hurricanes17_1
Looks like the first attempt of the Start_Date column was successfully removed! ### Tidying the Complicated Dates in the Duration column
Code
# Tidying the complicated dates in the Duration columnatlantic_hurricanes17_2 <- atlantic_hurricanes17_1%>%mutate(# extract year by pulling out digits of length 4 preceded by a commayear=as.numeric(str_extract(Duration,"(?<=, )[:digit:]{4}")), #extract# remove year from Duration columnDuration=str_remove(Duration,", [:digit:]{4}"),# extract start month by pulling out alpha characters preceded by a space and digitsstart_month=str_extract(Duration,"[:alpha:]*(?= [:digit:])"),# remove start month from Duration columnDuration=str_remove(Duration,"[:alpha:]*(?= [:digit:])"),# if there are still alpha numeric characters - that means there is a diff. end month# so pull that out# otherwise, start month = end monthend_month=case_when(str_detect(Duration,"[:alpha:]")~str_extract(Duration,"[:alpha:]+"),TRUE~start_month ),# remove end monthDuration=str_remove(Duration,"[:alpha:]+"),# remove all spacesDuration=str_remove_all(Duration," "),# pull out start daystart_day=str_extract(Duration, "[:alpha:]*[:digit:]{1,2}"),# now pull out end day by figuring out if there are numbers following a dash# otherwise, start day and end day are the sameend_day=case_when(str_detect(Duration,"-")~str_extract(Duration,"(?<=-)[:digit:]{1,2}"),TRUE~start_day )) atlantic_hurricanes17_2
Looks like all the date components (year, start_month, end_month, start_day, end_day) we need to make start date and end date columns have been mutated into separate, neater columns, sans dashes and spaces that characterized the former Duration column! ### Making Start Date and End Date Columns
Code
# making start_date and end_date columnsatlantic_hurricanes17_3 <- atlantic_hurricanes17_2%>%mutate(atlantic_hurricanes17_2, start_date=paste(start_month,start_day,year))atlantic_hurricanes17_3
Seems like I was able to successfully create start_date and end_date columns from mutating data from the start_day, start_month, end_day, end_month, and year columns!
Making Start Date and End Date Columns into a Tidy Date Format
Code
# changing start_date and end_date into a tidy date formatatlantic_hurricanes17_5 <- atlantic_hurricanes17_4 %>%mutate(start_date =mdy(start_date))atlantic_hurricanes17_5
# creating new duration_in_days columnatlantic_hurricanes_17_8 <- atlantic_hurricanes_17_7%>%mutate(duration_in_days= end_date - start_date)atlantic_hurricanes_17_8
Seems like the old/original Duration column has been removed and the new duration_in_days column properly shows the number of days between the start_date and end_date of each observation!This column now also reads as a time value (versus a character value), so even though it’s not numeric, in the forthcoming sections, I should still be able to use its data for summary statistics and visualization purposes.
Making a damage_millionsUSD column
Making the damage dollar amounts all the same unit (converting the thousands and billions into millions)
Code
# making a damage_$millionsUSD columnatlantic_hurricanes_17_8$damage_millionsUSD <-paste(atlantic_hurricanes_17_8$`Damage.$.amount`, atlantic_hurricanes_17_8$`Damage.$.unit`)atlantic_hurricanes_17_8
Code
# making all units into their proper number formatatlantic_hurricanes_17_9 <- atlantic_hurricanes_17_8%>%mutate(damage_millionsUSD=case_when(str_detect(damage_millionsUSD, "million") ~as.numeric(str_extract(damage_millionsUSD, "[\\d\\.]+")) *1000000,str_detect(damage_millionsUSD, "thousand") ~as.numeric(str_extract(damage_millionsUSD, "[\\d\\.]+")) *1000,str_detect(damage_millionsUSD, "billion") ~as.numeric(str_extract(damage_millionsUSD, "[\\d\\.]+")) *1000000000 ))atlantic_hurricanes_17_9
Code
# converting all numbers in damage_millionsUSD to millions (in compressed format without all the zeroes at the end)atlantic_hurricanes_17_9[c("damage_millionsUSD")] <- atlantic_hurricanes_17_9[c("damage_millionsUSD")]/1e6atlantic_hurricanes_17_9
Code
# renaming damage_millions column to damage_costnames(atlantic_hurricanes_17_9)[names(atlantic_hurricanes_17_9) =='damage_millions'] <-'damage_cost'atlantic_hurricanes_17_9
Seems like there’s now a damage_millionsUSD column where all the damage cost values (once in assorted thousands, millions, and billions units) have all been adjusted to being numbers in the millions unit.
Changing Start Day and End Day from Character value to Numeric value
Code
# changing start_day and end_day columns to read as having numeric valuesatlantic_hurricanes_17_10 <- atlantic_hurricanes_17_9%>%mutate(start_day=as.numeric(start_day), end_day=as.numeric(end_day))atlantic_hurricanes_17_10
Seems like the start_day and end_day variables now have numeric values!
Pairing down the number of years from 1920-2020 down to 2000-2020 for visualization and analysis purposes
Because performing certain visualizations with a century’s worth of data could produce a lot of small, perhaps illegible data points and figures, I’m pairing down the dataset to focus only on data from the years 2000-2020 and later on sometimes 2015-2020, to pull from a fitting amount of data for each graph while still hopefully producing readable visuals. Additionally as someone born in the late 1990s and from a hurricane-prone area, I am more familiar with the more contemporary hurricanes (factors that shaped their buildups and realities that characterize their aftermaths) that occurred in the past 20 or so years.
Code
# Editing down to only focus on years 2000-2020atlantic_hurricanes_17_11 <- atlantic_hurricanes_17_10[atlantic_hurricanes_17_10$year >="2000"& atlantic_hurricanes_17_10$year <="2020",]atlantic_hurricanes_17_11
Seems like the dataset has been successfully edited down to data on hurricanes from 2000-2020. Working with a smaller amount of data will be conducive for visualization purposes.
Data Visualizations and Analysis
RQ1: Does a hurricane’s max wind speed (mph) have any correlation with its max pressure measure (hPa)?
Scatterplot of Correlation between Max.wind.speed.mph and Max.pressure.hPa
Code
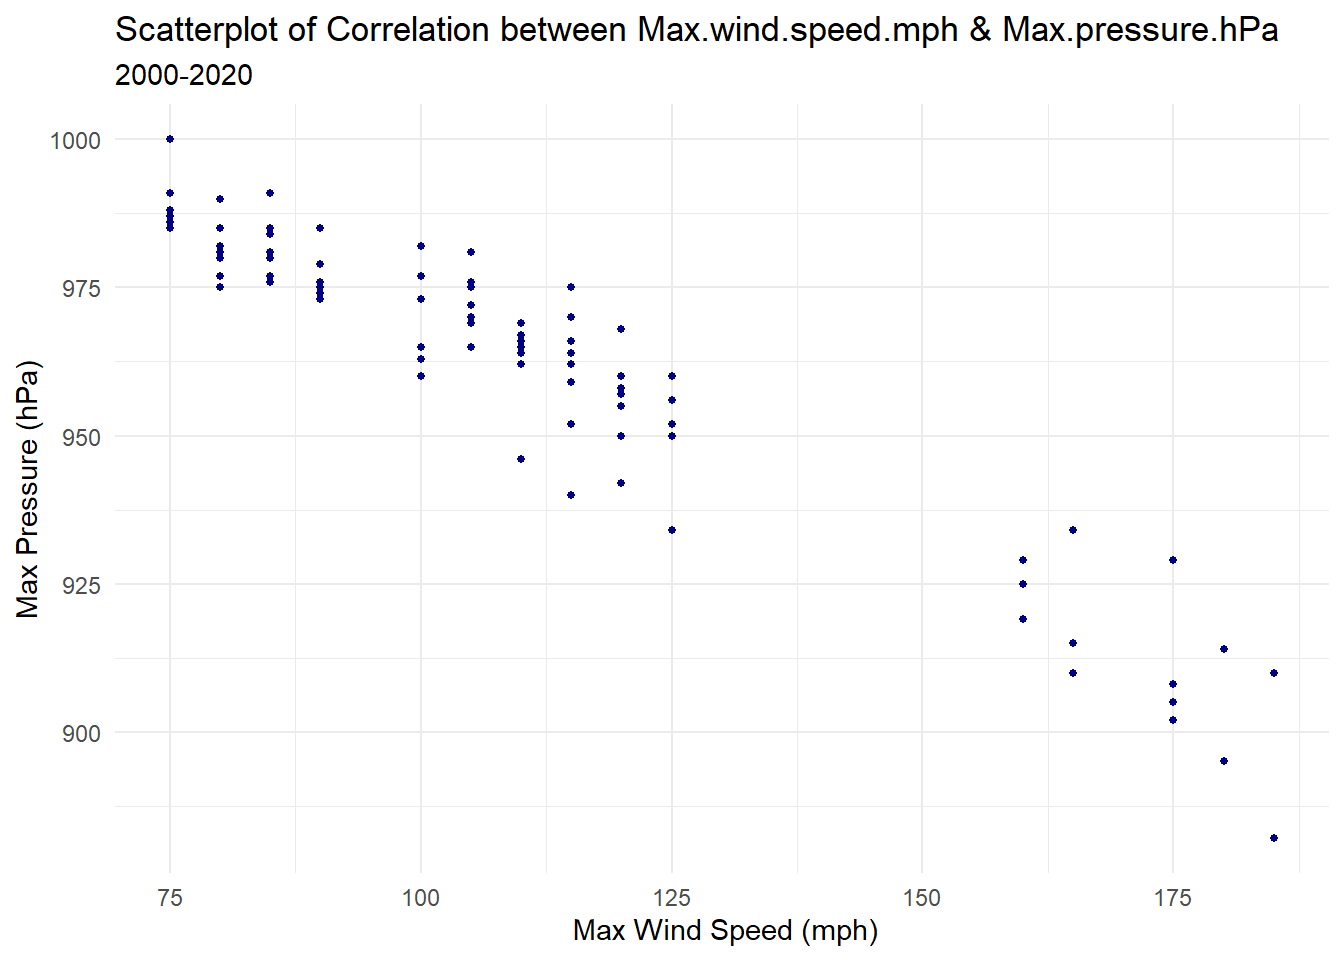
# Scatterplot of Correlation between Max.wind.speed.mph and Max.pressure.hPaggplot(atlantic_hurricanes_17_11, aes(x= Max.wind.speed.mph, y= Max.pressure.hPa))+geom_point(size=1, fill="navy", color="navy")+labs(title ="Scatterplot of Correlation between Max.wind.speed.mph & Max.pressure.hPa", subtitle ="2000-2020", x=" Max Wind Speed (mph)", y="Max Pressure (hPa)")+theme(axis.text.x =element_text(angle =30, size =2))+facet_grid()+theme_minimal()
For the most part, it seems as though as Wind Speed (mph) increases, Pressure (hPa) decreases–meaning that more severe hurricanes (with higher wind speeds and potentially higher category classification) tend to have lower pressure (hPa) measures. The Weather Channel (2019) confirms the findings from our plot, elaborating, “In general, a lower pressure means a more intense hurricane in terms of its winds and overall destructive potential. Conversely, a higher pressure indicates a weaker system” (The Weather Channel, 2019).
RQ2: Is the max wind speed measure a determining factor of hurricane category classification?
Bar Plot of Max Category by Max.wind.speed.mph sorted by Hurricane Name, 2015-2020
Code
#pair down to storms between 2015-2020atlantic_hurricanes_17_12 <- atlantic_hurricanes_17_11[atlantic_hurricanes_17_11$year >="2015"& atlantic_hurricanes_17_11$year <="2020",]atlantic_hurricanes_17_12
Code
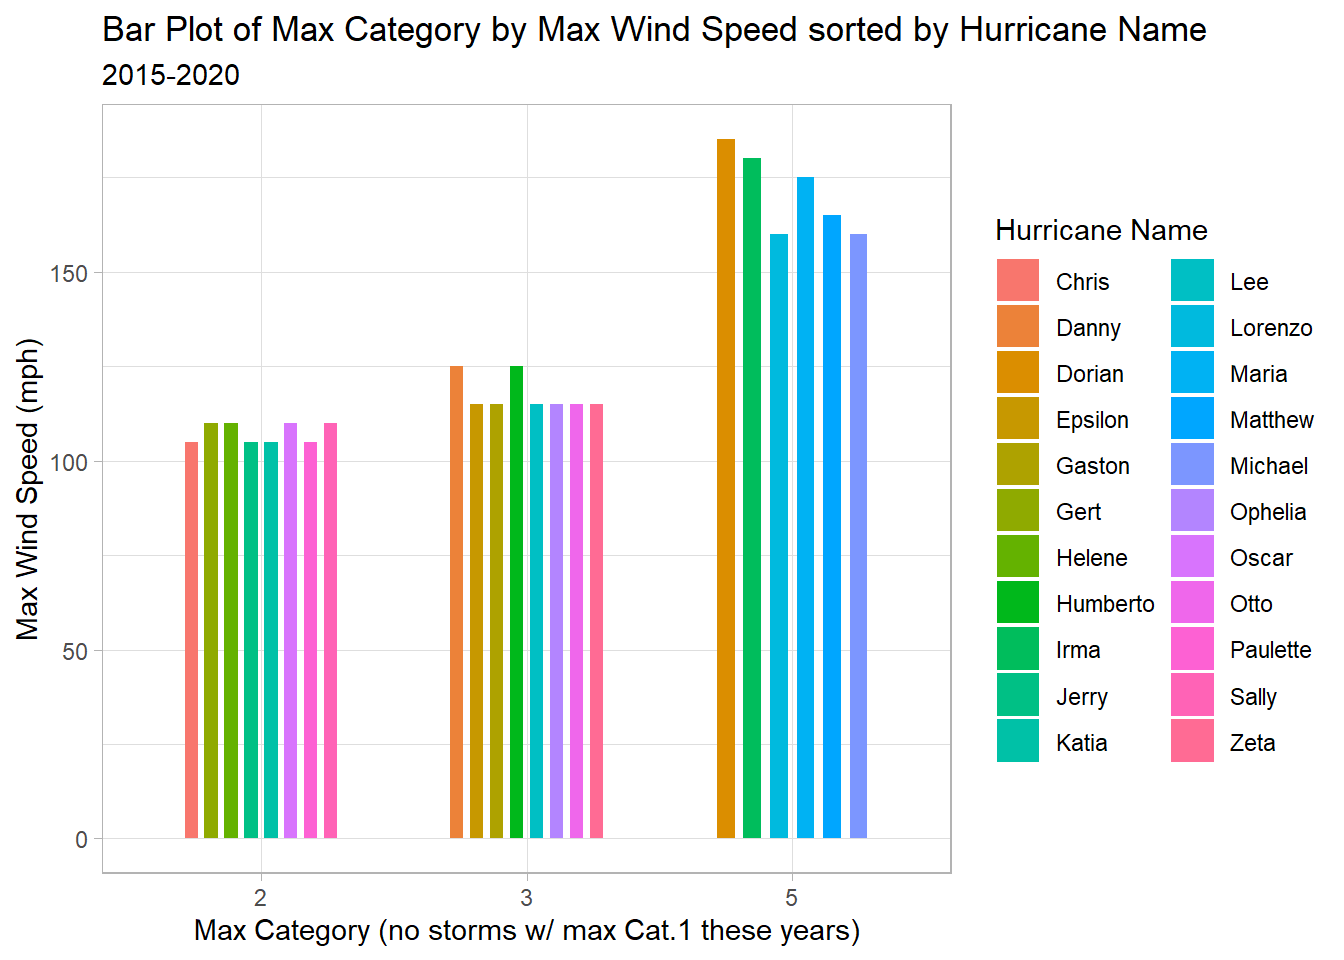
# factor Max.categoryatlantic_hurricanes_17_12$Max.category <-factor(atlantic_hurricanes_17_12$Max.category, levels =c("1", "2", "3", "5"))# bar plot of Max.category by Max.wind.speed.mph sorted by Hurricane Nameggplot(atlantic_hurricanes_17_12, aes(x= Max.category, y= Max.wind.speed.mph, fill= Name))+geom_bar(stat ="identity", position=position_dodge(width = .6), width =0.4)+labs(title ="Bar Plot of Max Category by Max Wind Speed sorted by Hurricane Name", subtitle="2015-2020", x="Max Category (no storms w/ max Cat.1 these years)", y="Max Wind Speed (mph)", fill="Hurricane Name")+facet_grid()+theme_light()
Between 2015-2020, it seems as though a majority of storms (16 out of 22 or 8/11ths) of hurricanes were either Category 2 or Category 3. With that said, 6 out of 22 or 3/11ths of hurricanes from 2015-2020 became Category 5 storms. From this it can be gathered that 2015-2020 produced a somewhat high amount of named hurricanes with relatively high max category classifications (as stated in the chart, there were no storms with a max category of 1 in these years). From the bar plot, it seems as though there is a clear segmentation of (max) hurricane category by max wind speed (mph). Category 2 hurricanes depicted seemed to have a max wind speed slightly over 100mph; whereas Category 3 storms had wind speeds equivalent to or stretching towards 125 mph. Category 5 hurricanes during this time period had slightly more variation in their max wind speeds; the highest being Hurricane Dorian, a 2019 storm recorded to reach winds of up to 185 mph.
This visualization’s findings are congruent with the basis of the Saffir-Simpson Hurricane Wind Scale also known as the Saffir-Simpson Scale, the official classification system for hurricane categories. According to the National Hurricane Center (n.d.), “The Saffir-Simpson Hurricane Wind Scale is a 1 to 5 rating based only on a hurricane’s maximum sustained wind speed. This scale does not take into account other potentially deadly hazards such as storm surge, rainfall flooding, and tornadoes” (National Hurricane Center, n.d.). The National Hurricane Center (n.d.) lists “Sustained Winds” ranges for each of the categories:Category 1 “74-95 mph”, Category 2 “96-110 mph”, Category 3 “111-129 mph”, Category 4 “130-156 mph”, and Category 5 “157 mph or higher” (National Hurricane Center, n.d.). We can see that our data from the Max.wind.speed.mph variable corresponds well with(in) these established ranges.
RQ3: Are hurricanes getting more expensive? Is the dollar unit of damage costs per hurricane rising over the years?
Line Plot of Hurricane Count over the Years, 2000-2020, sorted by Damage dollar unit
Because of how we pivoted the data wider earlier on in the cleaning process so that each row can have its own land area affected, the data table as is repeats hurricane names and affiliated info about each hurricane (all variables except Land.areas.affected) for each hurricane. It is important to be mindful of this in the visualization section, especially in visuals where we are plotting hurricane count, because we don’t want skewed data saying that there’s a higher amount of hurricanes than there actually were. For example, 1 hurricane may have impacted 4 different areas, so there are 4 rows with the same hurricane and the only differentiating characteristic between those 4 rows is what’s listed in each their respective cells in the Land.areas.affected column. With that said by inputting the Name variable within the unique() and n_distinct() functions before creating the line plot, we should hopefully get the ‘official’ hurricane count per damage dollar unit per year, as in without skewed figures due to the repetition of hurricane names.
Code
# Line Plot of Hurricane Count over the Years, 2000-2020, sorted by Damage.$.unit# using group by and summarize to get count of hurricanes per year and per Damage.$.unit and using unique() and n_distinct() so that hurricane names don't repeatatlantic_hurricanes_17_13 <- atlantic_hurricanes_17_11 %>%group_by(year, `Damage.$.unit`, Name) %>%summarize(unique_hurricanes=unique(Name), n_distinct(Name))%>%summarize(count=n())atlantic_hurricanes_17_13
Code
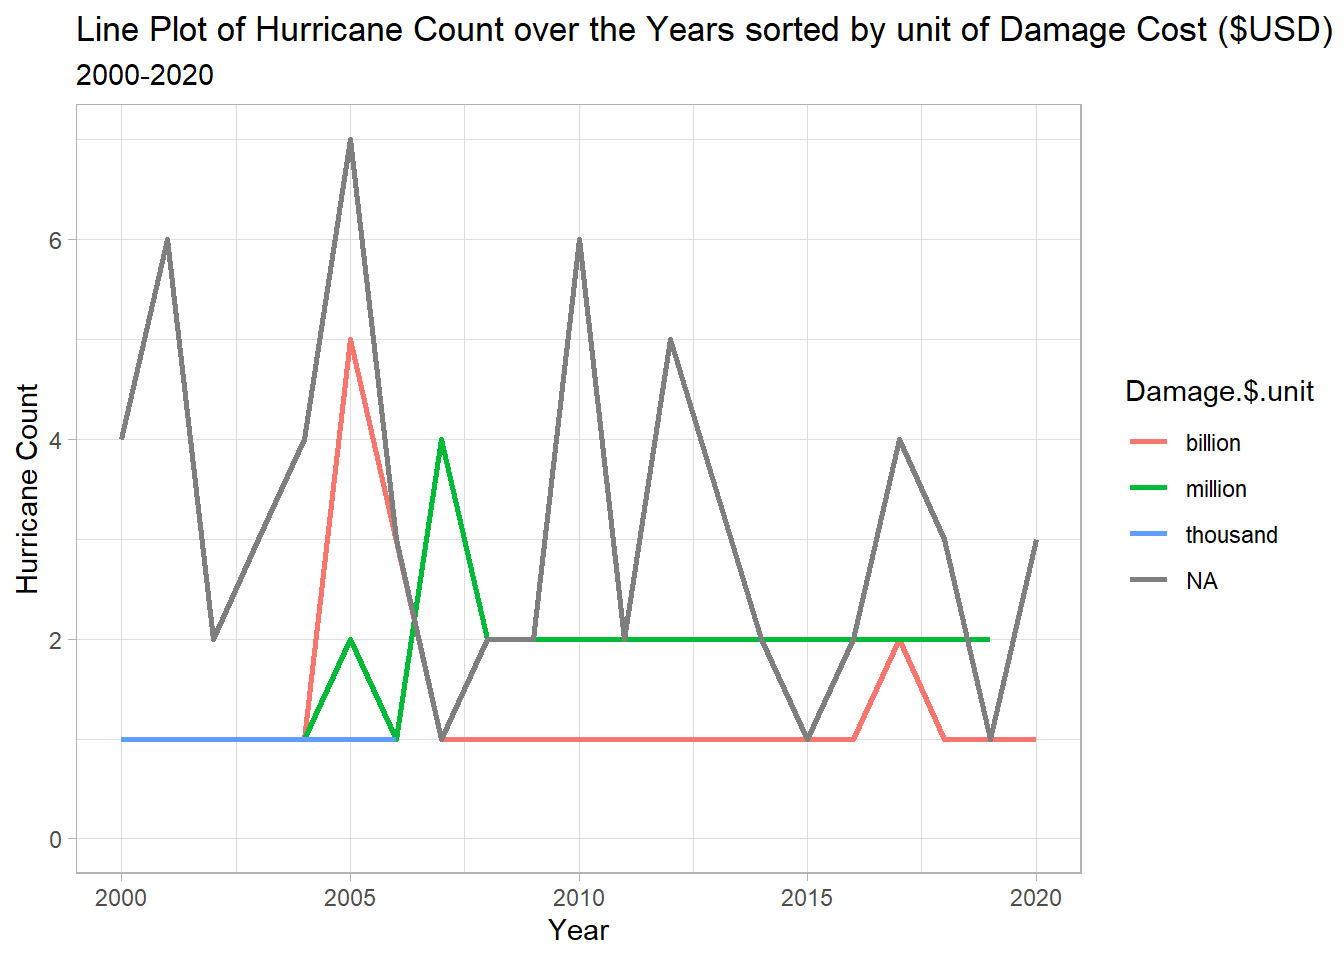
# making the line plotggplot(data = atlantic_hurricanes_17_13, aes(x= year, y= count, color=`Damage.$.unit`))+geom_line(size=1)+facet_grid()+ylim(0,7)+labs(title="Line Plot of Hurricane Count over the Years sorted by unit of Damage Cost ($USD)", subtitle="2000-2020", x="Year", y="Hurricane Count", color="Damage.$.unit")+theme_light()
Much like earlier versions of our dataset that spanned from 1920-2020, we can see that a considerable amount of storms in the last 20 years captured by the dataset have damage cost amounts and dollar units that read as NA–so this dataset and this line plot do not give us the most comprehensive and precise information in the realm of tracking hurricane damage costs across time. It should be noted that just because the damage costs for a hurricane are listed as NA in this dataset, does not mean a hurricane didn’t actually cause a hefty and highly expensive amount of damage in the thousands, millions, or billions of dollars. To me, the relatively high prevalence of NA values in the damage dollar amount and damage dollar unit variables across this dataset evidences that precisely calculating the monetary damage incurred by a hurricane is an increasingly complex task. Even with the experiences and logged estimates from prior storms, such monetary figure is prone to high uncertainty and constant fluctuation, especially with storms that span across states, regions, and countries–and even those that remained confined to a smaller area. Many things can become damaged in the event of a hurricane, so there’s always a myriad of components to consider in what constitutes the cost of damage. Moreover, qualifying hurricane damage in solely quantitative terms/metrics doesn’t paint the full picture, but, on the other hand, working with solely qualitative descriptors of damage can potentially become too subjective. Some of the values in the original Damages
With that said, from how the line plot displays the non-NA Damage dollar units of thousand, million, and billion, we can deduce that the dollar unit of hurricane damage costs have incurred significant changes between 2000-2007 but remained relatively stable post 2008 or so. In 2000, there were the same amount of hurricanes that cost in the thousands and hurricanes that cost in the millions (1 of each). Moreover, in 2000 there were zero recorded storms costing in the billions of dollars worth of damage. Shortly thereafter, this changes–by 2005, hurricanes costing millions of dollars outpace hurricanes costing in the thousands of dollars by 2 to 1 (they would briefly go back to having an equal count in 2006). Shortly after 2005 (seemingly with an ‘end-point’ of sorts in 2006 according to the data table), there are no further recorded hurricanes with damage costs remaining within the thousands of dollars. Furthermore, slightly after the midpoint between 2000 and 2005 (in 2003 according to the data table), we are introduced to hurricanes that incur damage costs in the billions of dollars, and the following years (to 2020) have mostly continued to produce storms that cost in the billions of dollars. According to the grouped data table, in 2005, there were 14 hurricanes total–half of them read as NA, meaning we have no damage dollar costs/unit info available. Of the 14, five were hurricanes costing in the billions of dollars–the highest count for the billions unit recorded in the data from 2000-2020. Short of one hurricane, our findings are largely consistent with Pradhan (2022), who writes, “Based on historical records and facts, the 2005 season was the most destructive when 28 named storms were recorded, 15 of which were hurricanes” (Pradhan, 2022). The “Total Financial Damage” costs of “Over 172 Billion USD” that Pradhan (2022) reports for the 2005 Hurricane season compliments the visual our line plot provides of the record-high count of hurricanes with damage costs in the billions unit (Pradhan, 2022). While no year after 2005 in the dataset has produced a higher amount of total hurricanes (with max. categories of 1, 2, 3, and 5), we do see that even in more recent years with fewer total hurricanes, there are consistently hurricanes that cause damage in the billions and a little more so in the millions of dollars.
RQ4: Is there a relationship between number of deaths and a hurricane’s damage cost(adjusted to millions USD)? Do hurricanes of higher categories cause more deaths? Do hurricanes of higher categories have higher damage costs?
Scatterplot of Relationship between Deaths and damage_millionsUSD, 2000-2020 sorted by Max.category
Code
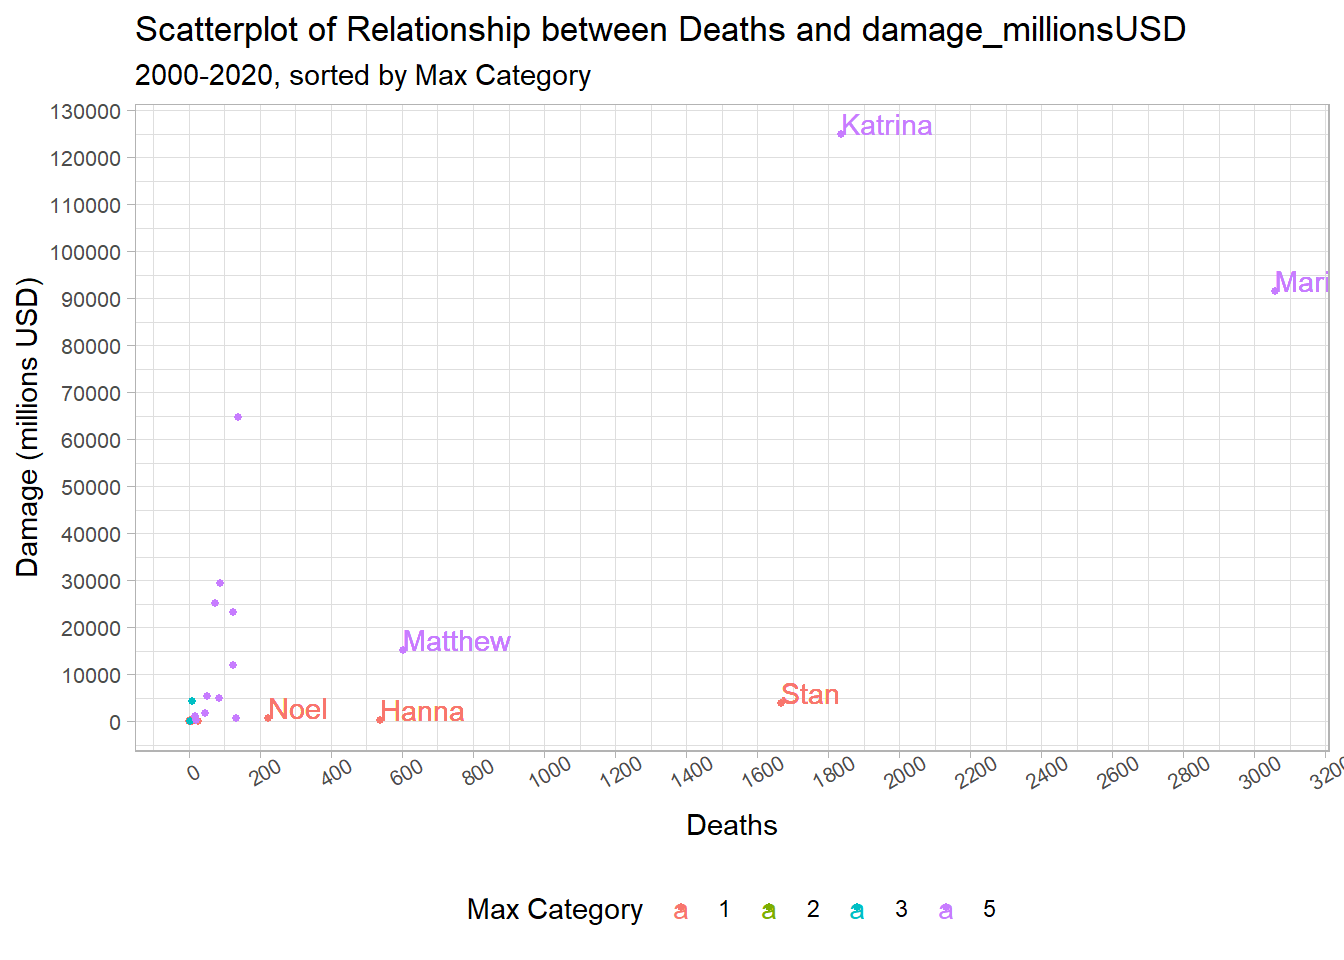
# Scatterplot of Relationship between Deaths and damage_millionsUSD, 2000-2020, sorted by Max.category# factor Max.categoryatlantic_hurricanes_17_11$Max.category <-factor(atlantic_hurricanes_17_11$Max.category, levels =c("1", "2", "3", "5"))#making the scatterplotggplot(atlantic_hurricanes_17_11, aes(x= Deaths, y= damage_millionsUSD, color=Max.category, label=Name))+geom_point(size=1)+geom_text(aes(label=ifelse(Deaths>200,as.character(Name),'')), hjust=0, vjust=0)+labs(title ="Scatterplot of Relationship between Deaths and damage_millionsUSD", subtitle ="2000-2020, sorted by Max Category", x="Deaths", y="Damage (millions USD)", color="Max Category")+theme_light()+facet_grid()+scale_y_continuous(breaks = scales::pretty_breaks(n =12))+scale_x_continuous(breaks = scales::pretty_breaks(n =16))+theme(axis.text.x =element_text(angle =30, size =8))+theme(axis.text.y =element_text(size =8))+theme(legend.position='bottom')
Given that some damage_millionsUSD and/or Deaths values read as NA for some hurricanes in the dataset, there is a considerable amount of data not represented in this scatterplot. For example, Hurricane Jeanne, a Category 3 hurricane that struck in 2004 and was estimated to have a death toll of 3037, is visible in the data table but its ‘would-be’ light blue point does not appear in the scatterplot because its damage_millionsUSD value reads as NA. To put the amount of ‘missing data’ in this visualization into perspective, while loading the graph, R returned a warning message that it “Removed 137 rows containing missing values” (R Core Team, 2023).
While it is harder to fully parse out the data points that are clustered together at the start of the graph, we can see that for the most part, Category 5 hurricanes tend to produce the costliest damage in the years 2000-2020. In particular, there were two Category 5 hurricanes that produced the highest death tolls and damage counts in this time span: Hurricane Maria in 2017(claiming 3057 lives and costing 91,600 millions or 91.6 billion) and Hurricane Katrina in 2005(claiming 1836 lives and costing 125,000 million or 125 billion).
With that said, we can also see that three Category 1 hurricanes, while having a slightly lower damage_millionsUSD cost than some other Category 5 and Category 3 hurricanes, did incur sizable death tolls. Looking back at the data table to identify those points, Hurricane Stan caused 1668 deaths in 2005, Hurricane Hanna caused 537 deaths in 2008, and Hurricane Noel caused 222 deaths in 2007. This proves that hurricane category in and of itself is not a firm indicator of death toll and that hurricanes, regardless of their category are severe weather systems capable of disrupting livelihoods, the flow of essential resources like power/electricity, food and clean water access, etc. Moreover, some locales/communities/populations are disproportionately more vulnerable to the conditions produced by hurricanes and the widespread disruptions they cause than others (Torani et al., 2019; So et al., 2020). To me, this small trend of three Category 1 hurricanes with high death tolls can speak to discrepancies in public perception of hurricane severity(i.e. capacity to cause death and destruction) based on category classification. Erdman (2020) of The Weather Channel, corroborates this finding, writing, “A hurricane’s intensity frequently doesn’t correlate to its deadly potential” (Erdman, 2020). All in all, while this visualization does provide a snapshot into the relationship between death tolls and damage costs incurred by hurricanes, it does not provide the most comprehensive picture given the amount of data within the Deaths and damage_millionsUSD variables that have NA values.
RQ5: Do hurricanes with a higher max Category have a longer duration (in days)?
Bar Plot of Hurricane Name by Duration (in days), sorted by Max.category, 2015-2020
Code
# Bar Plot Hurricane Name by Duration (in days), sorted by Max.category 2015-2020# grouping data by Name, duration_in_days, Max.categoryatlantic_hurricanes_17_12_1 <- atlantic_hurricanes_17_12%>%group_by(Name, duration_in_days, Max.category)%>%mutate(duration_in_days=as.numeric(duration_in_days))atlantic_hurricanes_17_12_1
Code
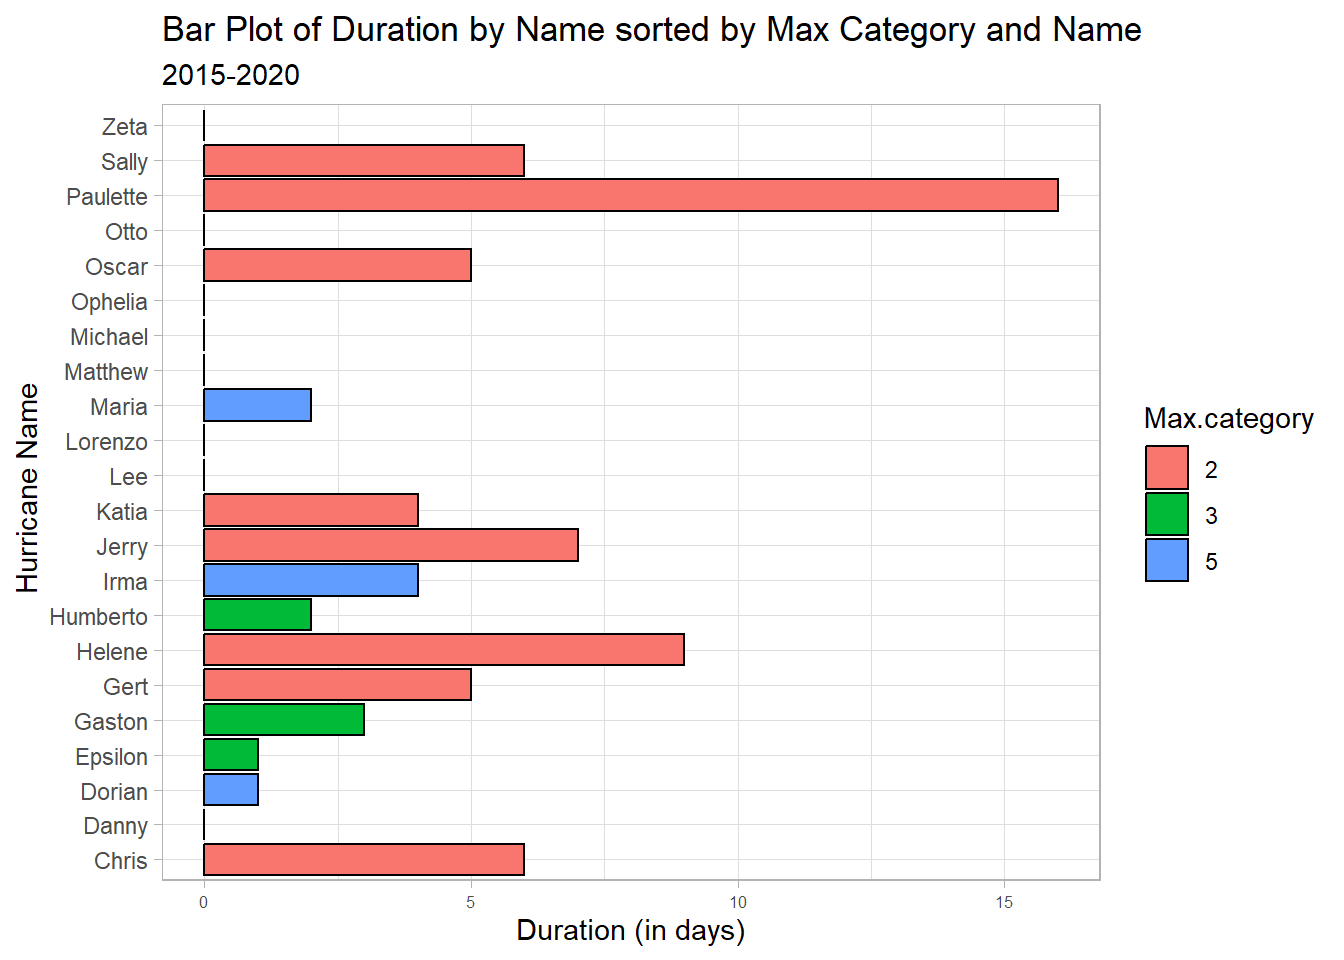
# making the Bar Plotggplot(atlantic_hurricanes_17_12_1, aes(x=Name, y=duration_in_days, fill=Max.category))+geom_bar(position="dodge", stat="unique", color="black")+labs(title ="Bar Plot of Duration by Name sorted by Max Category and Name", subtitle ="2015-2020", x=" Hurricane Name", y="Duration (in days)", fill="Max.category")+theme_light()+theme(axis.text.x =element_text(size =6))+coord_flip()
From what we can see from this horizontal bar plot of hurricanes from 2015-2020, there is a somewhat of an unclear correlation between hurricane duration (in days) and Max.category. In this visualization, several Category 2 hurricanes appear to have the longest duration in days, while Category 3 and Category 5 hurricanes during those years seem to mostly have shorter durations. For example, Hurricane Paulette occurred in 2020, reached a max Category 2 and had a duration of 16 days from September 7-September 23, 2020. In contrast, in 2018, Hurricane Michael intensified all the way to a Category 5 and had a duration of 0 days (or alternatively less than a full day) from October 10-October 10, 2018.
This suggests that time/duration itself does not intensify hurricanes/raise their category; i.e., disproving the notion that a hurricane of a higher/the highest Category has to have a longer duration than a hurricane of a lower/lowest Category. It’s not to say that time/duration(in days) has no influence on hurricanes and how we map, track & contextualize their broader impact; rather it is to call attention to the fact that a mix of atmospheric and environmental conditions, that are more situational in nature, such as water temperature, the presence of dry versus humid air, wind shear, the speed at which the system moves, etc more substantively influence hurricane development and intensification (National Weather Service staff, n.d.). In other words, a hurricane can intensify to a Category 5 in a short span of time given certain conditions,a tropical storm(which will have received an official ‘hurricane’ name) can take longer to intensify to a Category 1 hurricane given certain conditions, a hurricane can fluctuate between a Category 1 and Category 2 but not intensify beyond that given certain conditions, etc.
However, this visualization does call into question how the creator of this dataset, Liamtsau (2022) and the source(s) they compiled the data from–“Wikipedia”–interpret duration (Liamtsau, 2022). How did they determine the start date and end date they provided for each hurricane in the dataset? Is the start date marking the beginning of the tropical system even before it became a hurricane? Is the end date marking the final dissipation of the system, after it has de-intensified and is no longer classified as a hurricane? Are the dates specific to when a hurricane was the Max.category it is listed at in the dataset? Are the dates specific to landfall (and landfall as a hurricane vs as a tropical storm or tropical depression)? There are a handful of possibilities as to how to create a timeframe for the duration of a storm.
Since Liamtsau (2022) used information from Wikipedia to create the dataset, let’s see what information regarding dates can be found on the Wikipedia page for 2018’s Hurricane Michael. Under the “Meteorological history” section in the infobox at the top of the page, 3 significant dates are listed: “Formed October 7, 2018”, “Extratropical October 11, 2018”, “Dissipated October 16, 2018” (Wikipedia contributors, 2023). Furthermore, a line in the introduction section reads, “making landfall near Mexico Beach, Florida, on October 10, becoming the first to do so in the region as a Category 5 hurricane” (Wikipedia contributors, 2023). In less than 24 hours after landfall, Hurricane Michael de-intensified to (and subsequently ‘less than’) a Category 1 storm (Wikipedia contributors, 2023).
This means that our dataset, which for Hurricane Michael marks a start date and end date of October 10, 2018, associates ‘start date’ with (first area of) official landfall and ‘end date’ seemingly with the last day the hurricane retained official hurricane classification before transitioning into an extratropical system. It’s worthwhile to mention that a hurricane can still impact/inflict damage upon land areas without officially making landfall. Pointedly, this was the case of Hurricane Michael, which impacted Central America and Cuba before making official landfall in Florida on the Gulf Coast side (Wikipedia contributors, 2023). According to NOAA’s National Weather Service- Glossary (n.d.), “Extratropical” is defined as follows: “A term used in advisories and tropical summaries to indicate that a cyclone has lost its ‘tropical’ characteristics. The term implies both poleward displacement of the cyclone and the conversion of the cyclone’s primary energy source from the release of latent heat of condensation to baroclinic (the temperature contrast between warm and cold air masses) processes. It is important to note that cyclones can become extratropical and still retain winds of hurricane or tropical storm force” (NOAA’s National Weather Service - Glossary, n.d.).
Thus, while the extratropical classification–and by extension the end dates provided in our dataset–do not mark the complete dissolution of the storm system, it marks a turning point nonetheless, i.e., when a system phases out of its “‘tropical’ characteristics” but can still present as an intensive weather system with hurricane-like conditions that have the capacity to impact areas, lives, etc (NOAA’s National Weather Service - Glossary, n.d.).
RQ6: Which areas listed in the Land.areas.affected column are suseptible to the most hurricanes?
This question will be answered with two alternate visualizations, a bar plot charting frequency and a pie chart based on calculating the proportion of each land area in the Land.areas.affected variable. ## Bar Plot Frequency of Land Areas Affected by Hurricanes, 2015-2020
Code
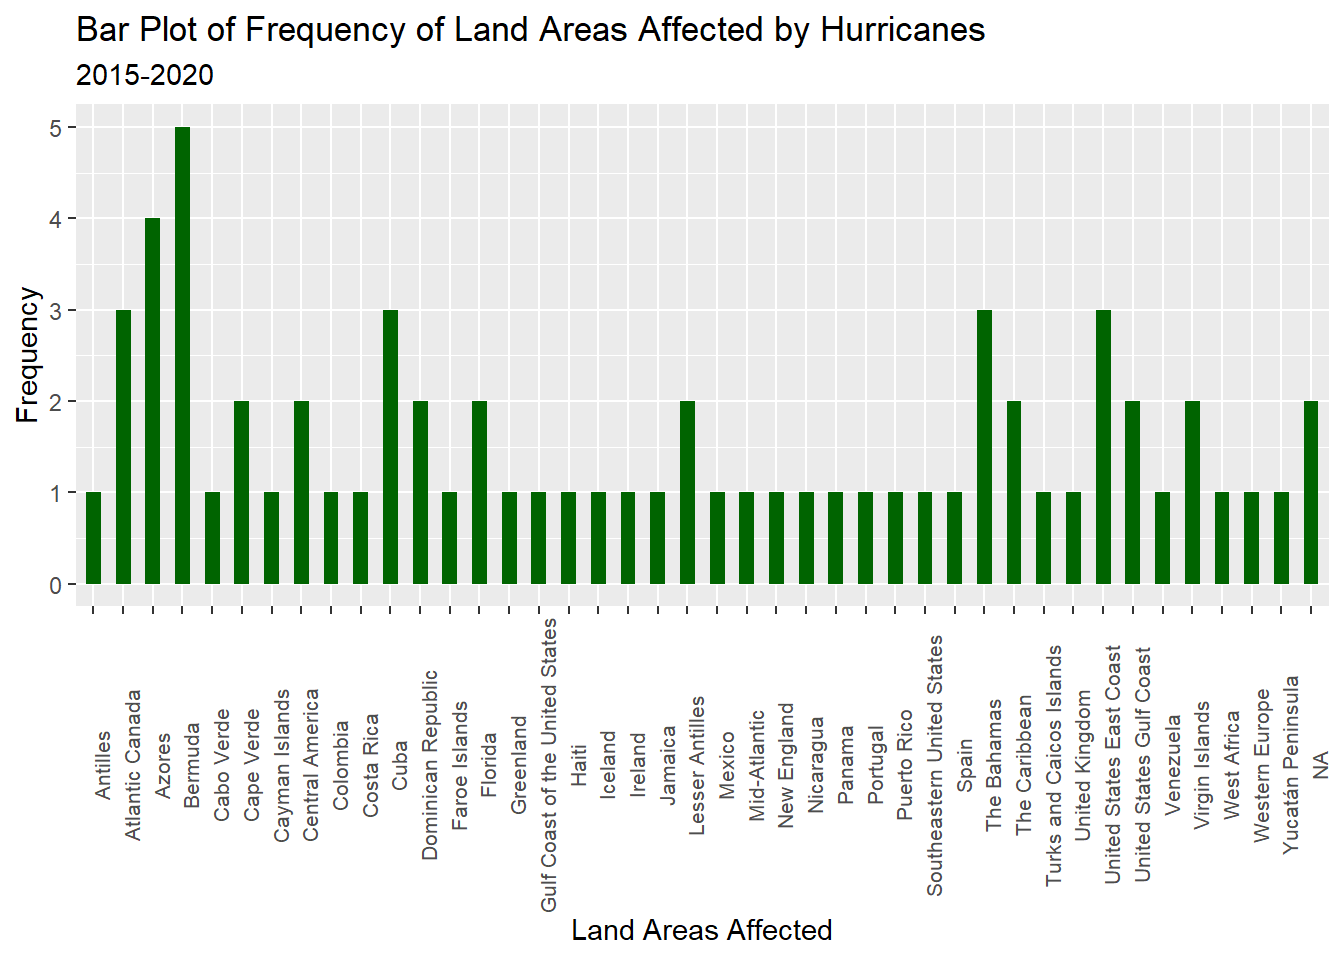
## Bar Plot of Frequency of Land Areas Affected by Hurricanes, 2015-2020ggplot(data = atlantic_hurricanes_17_12, aes(x= Land.areas.affected))+geom_bar(width= .5, fill="darkgreen")+facet_grid()+theme(axis.text.x =element_text(angle =90, size =8))+labs(title="Bar Plot of Frequency of Land Areas Affected by Hurricanes", subtitle ="2015-2020", x="Land Areas Affected", y="Frequency")
It is important to note that this visualization and below does not provide the most precise frequency data because there is some overlap and repetition amongst values in the Land.areas.affected column in the dataset. For example, “Gulf Coast of the United States” and “United States Gulf Coast” assumingly refer to the same area but are represented as distinct character values in the data. Moreover, “Cabo Verde” and “Cape Verde” are Portuguese and English translations of the same place. In terms of overlap, the “Dominican Republic”, “Haiti”, “The Bahamas”, “Jamaica”, “Puerto Rico”, and “Cuba” are all located in the Caribbean and have distinct character values, but “The Caribbean” also features as its own, distinct character value. The same can be said for Central American nations (like “Costa Rica”, “Nicaragua”, and “Panama”) being listed as well as “Central America”, and likewise, “Florida” has its own distinct value even though it is technically a state in the US Gulf Coast. During the earlier data cleaning phases of this project, the course instructor and I discussed how to make sense of this/go about cleaning it, but I ultimately decided against it as a means to not over-manipulate the original data. Lastly, another limitation of this graph and this dataset more broadly, is that it also does not account for the frequency in which hurricanes with a max Category of 4 and other tropical and extratropical systems impacted these land areas; thus, the full scope of systems that impacted land areas during Hurricane seasons 2015-2020 is not fully showcased in this data.
With that said, some insights into land areas most impacted by hurricanes can still be gleaned from this bar plot as-is. From 2015-2020, Bermuda was impacted by 5 hurricanes and appears as the land area with the highest hurricane frequency. Though we’d have to look back at the data table to see how this is spread across the five years, Bermuda being hit by five hurricanes in a five year period is slightly higher than Hurricane City’s (n.d.) projection that Bermuda gets “brushed or hit every 1.74 years” (Hurricane City, n.d.). Hurricane City (n.d.) does account for this increase in frequency more broadly, noting, “Activity trending up” (Hurricane City, n.d.).
Next, the Azores, an archipelago that is part of Portugal, experienced 4 hurricanes during that time span (Silva, 2022). Atlantic Canada, Cuba, The Bahamas, and the United States East Coast–as listed–each experienced 3 hurricanes in the years between 2015-2020. Four out of six or two-thirds of the land areas listed as experiencing 3 to 5 hurricanes between 2015-2020 are islands/island clusters. Because Atlantic hurricanes develop in open waters, islands–especially those further away larger land masses–and situated open bodies of water (like the Atlantic Ocean, Gulf of Mexico, Caribbean Sea, etc) are uniquely susceptible to being hit by hurricanes. Donvito (2023) extends this argument in a regional Caribbean context, mentioning, “Although some experts say there’s no such thing as a ‘hurricane belt,’ certain islands do get hit more often due to weather patterns and trade winds. So, the northeastern Caribbean islands are more likely to be struck, with islands closer to South America less likely and worth taking the small risk of a storm” (Donvito, 2023). The Bahamas and Cuba, two of the six or one-third of the affected land areas with a high hurricane frequency are located in the Caribbean. For additional context, findings about The Bahamas and Cuba from our bar plot should be analyzed alongside a 2020 study conducted by the University of Bristol that found the Caribbean “to be particularly vulnerable to climate change, resulting in extreme hurricane rainfall events being as much as five times more likely in a warmer world” (University of Bristol, 2020; L Vosper et al., 2020).
As a native of New Orleans which is situated in the Gulf Coast of the United States, I can attest to the high frequency of hurricanes and other tropic activity in this region. I thought it would be worthwhile to mention that combining the frequencies of “Gulf Coast of the United States” and “United States Gulf Coast”, returns a frequency of 3 hurricanes, which would also place the US Gulf Coast region in what I’m deeming (from this bar plot) as a high frequency of hurricanes in the years of 2015-2020.
Pie Chart of Proportional Makeup of Land Areas Affected by Hurricanes, 2015-2020
Code
# Pie Chart of Proportional Makeup of Land Areas Affected by Hurricanes#getting proportion of land.areas.affectedatlantic_hurricanes_17_14 <-prop.table(table(atlantic_hurricanes_17_12[["Land.areas.affected"]]))atlantic_hurricanes_17_14
Antilles Atlantic Canada
0.015625 0.046875
Azores Bermuda
0.062500 0.078125
Cabo Verde Cape Verde
0.015625 0.031250
Cayman Islands Central America
0.015625 0.031250
Colombia Costa Rica
0.015625 0.015625
Cuba Dominican Republic
0.046875 0.031250
Faroe Islands Florida
0.015625 0.031250
Greenland Gulf Coast of the United States
0.015625 0.015625
Haiti Iceland
0.015625 0.015625
Ireland Jamaica
0.015625 0.015625
Lesser Antilles Mexico
0.031250 0.015625
Mid-Atlantic New England
0.015625 0.015625
Nicaragua Panama
0.015625 0.015625
Portugal Puerto Rico
0.015625 0.015625
Southeastern United States Spain
0.015625 0.015625
The Bahamas The Caribbean
0.046875 0.031250
Turks and Caicos Islands United Kingdom
0.015625 0.015625
United States East Coast United States Gulf Coast
0.046875 0.031250
Venezuela Virgin Islands
0.015625 0.031250
West Africa Western Europe
0.015625 0.015625
Yucatán Peninsula
0.015625
Code
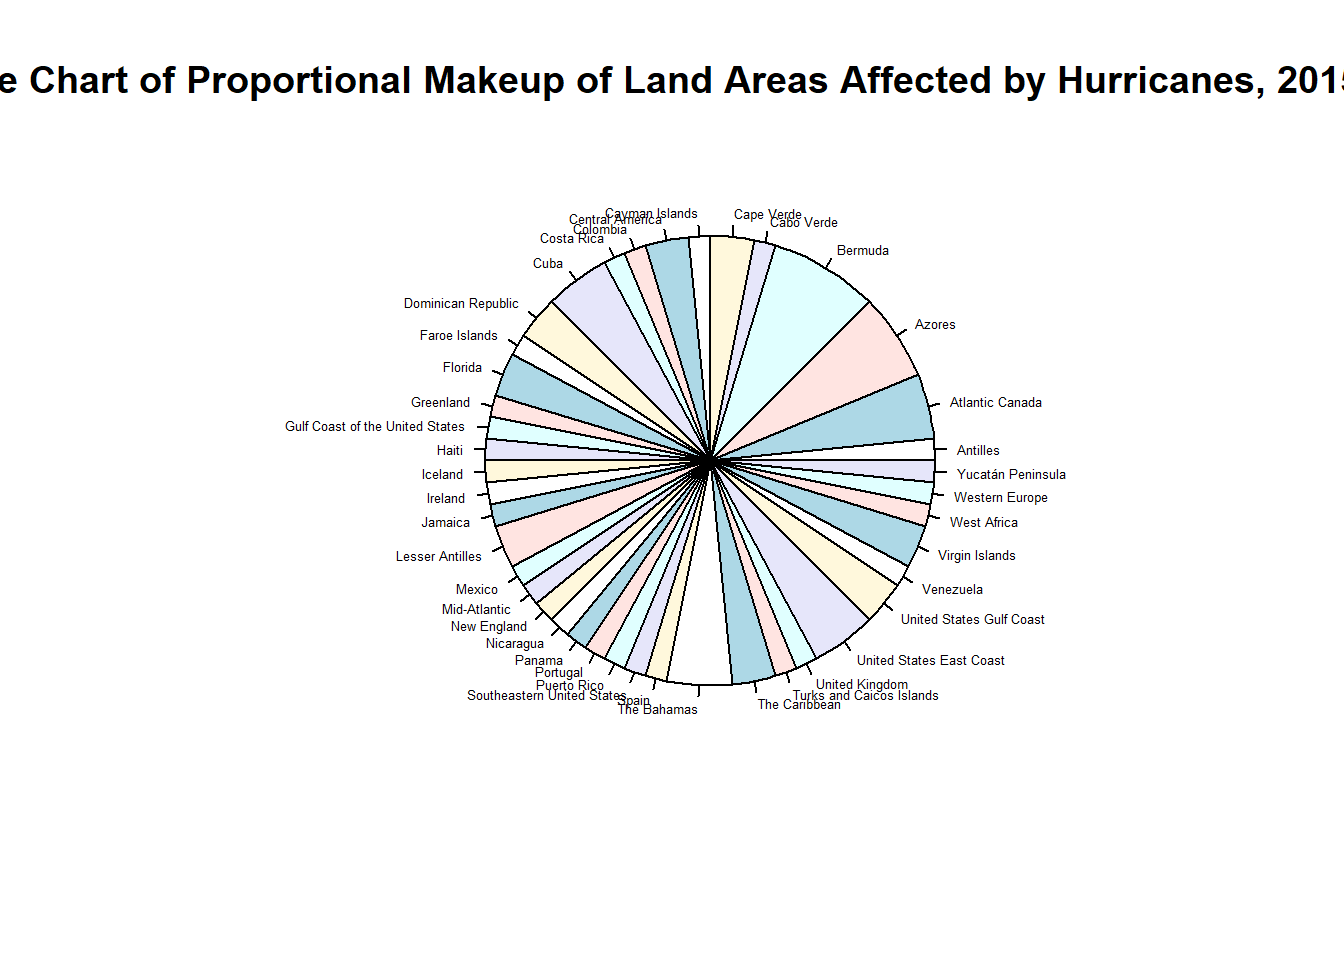
# making the Pie chartpie(atlantic_hurricanes_17_14, cex=.4, main ="Pie Chart of Proportional Makeup of Land Areas Affected by Hurricanes, 2015-2020")
This pie chart doesn’t provide the most precise information as it relates to proportional data of certain land areas featured in the Land.areas.affected column due to the same reasons are the bar chart above.
With that said, the way in which the pie chart visualizes proportional value alloted to each land area in the Land.areas.affected column largely captures a similar understanding compared to plotting frequency and Land.areas.affected with a bar chart. Bermuda, Azores, Atlantic Canada, Cuba, The Bahamas, and the United States East Coast each seem to occupy larger-sized portions of the circle.
Conclusion/Critical Reflection/Limitations of Dataset
Overall, this atlantic hurricanes dataset that I sourced from Liamtsau (2022) on Kaggle serves as an imperfect, yet extensive repository of a century’s worth of valuable hurricane-related information spanning from historical to contemporary eras (Liamtsau, 2022). I think it provides insights relevant to educating the general public (especially populations across the affected land areas) in an era where its increasingly essential to be weather aware and attune to the factors influencing and being influenced by climate change. In addition, while I doubt my analyses produced any altogether novel, previously undiscovered information, I believe its information can also be reviewed by those currently fields such as meteorology, climatology & other environmental sciences, disaster and emergency management, global studies, history, statistics, regional planning and public administration, public health, social services, etc and be put in conversation with their ongoing research, work, and other efforts to build resilience before, during, and in the wake of natural disasters.
On the other hand, there are some limitations to this dataset. Something I noticed this dataset doesn’t answer is, at what point in the duration of the hurricane were these measures of wind speed and pressure taken? While I’m assuming it is a listing of the highest intensity recorded wind speed and pressure throughout the course of the storm, this isn’t clear. Moreover, for the hurricanes that impacted multiple areas, the wind speed and pressure was likely not the exact same measure in each successive location the hurricane made landfall in. Additionally, instead of blanket/totaled/maxed and thus singular figures for most of the variables, what was the damage cost, death toll, duration, and max.category in each area affected per hurricane (understandably this creates a much larger dataset)? How could we equitably capture qualitative descriptors of the damage (as well as monetary estimates in other currencies besides USD) from impacted communities globally? While valuable insights can be deduced from this dataset–as stated previously, studying each storm and each area individually will provide additional, more full and nuanced context(s) of systems, resources, lived experiences, etc that influenced and/or were influenced by the hurricane(s).
From working with this dataset that was originally created for the purpose of being a data cleaning challenge, I can confirm that I spent a sizeable amount of time doing precisely that–cleaning the data and asking questions about the best techniques and alternate ways of doing so (Liamtsau, 2022). From this I learned that attention to detail and determination to see through each stage of working with data with the intent to communicate a story with it is at the heart of a committed data scientist’s work. With that said, I was able to use this dataset to gather summary statistics and explore a handful of inquiries through visualizations: the correlation between measures of max wind speed (mph) and max pressure (hPa), the relationship between max wind speed (mph) and category classification according to the Saffir-Simpson scale, trends in units of hurricane damage costs over time, the relationship between death toll and damage cost (adjusted to millions USD), the relationship between the duration of days and max category reached by a hurricane, and observances of land areas most frequently impacted by hurricanes. There are several other analyses that can be embarked on with this dataset which I did not pursue in this project but can be the basis for future work with this dataset, such as gathering summary statistics and visualizing the average start and end months to get insights into peak times within hurricane seasons across the years, using any of the map-centric graphs in ggplot to draw further attention to the land areas affected with the addition of a map backdrop, etc.
References
Personal Communications to Ask/Answer Dataset and R-related Questions from Class, Office Hours, Slack, Github, etc
A. Bertin, personal communication, July 2023.
S. Conway, personal communication, June-July, 2023.
S. Saluja, personal communication, June-July, 2023.
Dataset
Liamtsau, V. (2022, August 5). Atlantic hurricanes (data cleaning challenge). Kaggle. https://www.kaggle.com/datasets/valery2042/hurricanes
Topically-related
Donvito, T. (2023, January 25). 10 islands you can still visit in hurricane season. Reader’s Digest. https://www.rd.com/list/islands-you-can-still-visit-in-hurricane-season/
Erdman, J. (2020, September 13). Hurricane safety and preparedness| This is actually the biggest killer during hurricanes and tropical storms. The Weather Channel. https://weather.com/safety/hurricane/news/us-deaths-hurricanes-tropical-storms-nhc-study
Hurricane City. (n.d.). Bermuda’s history with tropical systems. Hurricane City. https://hurricanecity.com/city/bermuda.htm
L Vosper, E., M. Mitchell, D., & Emanuel, K.A. (2020). Extreme hurricane rainfall affecting the Caribbean mitigated by the paris agreement goals. Environmental Research Letters, 15.
National Hurricane Center (n.d.). Saffir-Simpson hurricane wind scale. National Hurricane Center. National Oceanic and Atmospheric Administration. https://www.nhc.noaa.gov/aboutsshws.php
National Weather Service staff. (n.d.). Hurricane facts. National Weather Service. https://www.weather.gov/source/zhu/ZHU_Training_Page/tropical_stuff/hurricane_anatomy/hurricane_anatomy.html
NOAA’s National Weather Service - Glossary. (n.d.). Extratropical. National Weather Service. https://forecast.weather.gov/glossary.php?word=extratropical
Pradhan, A. (2022, March 23). 10 most active hurricane seasons. Earth & Human. https://earthandhuman.org/most-active-hurricane-seasons/
Robinson, M., Coelho, D. P., & Smith, P. S. (2022). Family Health Care Nursing: Theory, Practice, and Research. Philadelphia: F.A. Davis. 7th edition.
Silva, L. (2022, January 16). The 9 islands of the Azores. Portugal.com. https://www.portugal.com/region/the-9-islands-of-the-azores/
So, M., Franks, J. L., Cree, R. A., & Leeb, R. T. (2020). An evaluation of the literacy demands of online natural disaster preparedness materials for families. Disaster Medicine and Public Health Preparedness, 14(4), 449–458. https://doi.org/10.1017/dmp.2019.62
The Weather Channel. (2019, July 24). Top five most intense U.S. hurricanes. The Weather Channel. https://weather.com/storms/hurricane/news/2019-07-24-five-most-intense-us-hurricanes-landfalls-pressure
Torani, S., Majd, P. M., Maroufi, S. S., Dowlati, M., & Sheikhi, R. A. (2019). The importance of education on disasters and emergencies: A review article. Journal of education and health promotion, 8(85), 1–7. https://doi.org/10.4103/jehp.jehp_262_18
University of Bristol. (2020, August 27). Hurricanes could be up to five times more likely in the Caribbean if tougher targets are missed. ScienceDaily. Retrieved from www.sciencedaily.com/releases/2020/08/200827130612.htm
Wikipedia contributors. (2023). Hurricane Michael. Wikipedia. https://en.wikipedia.org/wiki/Hurricane_Michael
Technical/Software
Holtz, Y. (2018). The R Graph Gallery. https://r-graph-gallery.com/index.html
R Core Team (2023). R: A language and environment for statistical computing. R Foundation for Statistical Computing, Vienna, Austria. URL https://www.R-project.org/
Wickham, H., & Grolemund, G. (2017). R for data science: Visualize, model, transform, tidy, and import data. O’Reilly Media. Retrieved from https://r4ds.had.co.nz/index.html
Source Code
---title: "Final Project: An Analysis of Atlantic Hurricanes from 2000-2020"author: "Hunter Major"editor: sourcedescription: Final Project on Atlantic Hurricanes 2000-2020date: "7/13/2023"format: html: df-print: paged toc: true code-fold: true code-copy: true code-tools: truecategories: - final_project - atlantic_hurricanes - hunter_major---## Loading Packages into R Studio```{r}# loading packages into R Studiolibrary(tidyverse)library(dplyr)library(readr)library(readxl)library(tidyr)library(googlesheets4)library(stringr)library(lubridate)library(ggplot2)knitr::opts_chunk$set(echo =TRUE, warning=FALSE, message=FALSE)```## IntroductionThroughout historical and contemporary eras, hurricanes have remained as one of the most prevalent and destructive forms of natural disasters, especially for several coastal regions and communities with relative proximity above and below the Equator. Hurricanes are known by a handful of other names globally, including cyclones and typhoons--though the name may differ, baseline characteristics of the storm formation remain the same. As a Black woman born and raised in New Orleans, Louisiana--a city in the hurricane-prone region of the Gulf Coast of the United States--I feel as though it is imperative for championing learning in non-formal, multi-generational settings to be responsive to the drastic environmental changes that surround us. Robinson et al. (2022) detail, “A primary goal of environmental health policy should be to eliminate health disparities and the uneven burden that vulnerable populations feel from adverse outcomes…Environmental literacy, also known as ecological literacy or ecoliteracy, is an awareness about the environment and environmental problems, and the knowledge or methods to address those problems” (Robinson et al., 2022, pg. 348). With that said, data science and computational approaches have been used for decades to engage multi-dimensional studies of hurricanes. More can be done to ensure that such data is community-facing and accessible to marginalized populations within hurricane-prone areas and inclusive of their input and evaluation the data. In this project, I hope to use my embeddedness in a hurricane prone area and the skills I've gained in DACSS 601 to produce an analysis of a hurricane-related dataset as a small but worthwhile site of further building eco-literacy. ## Reading in the Data```{r}# reading in the dataatlantic_hurricanes <-read_csv("_mysampledatasets/atlantic_hurricanes.csv")atlantic_hurricanes```## Narrative About The Data```{r}summary(atlantic_hurricanes)dim(atlantic_hurricanes)```I sourced atlantic_hurricanes.csv from Kaggle, https://www.kaggle.com/datasets/valery2042/hurricanes, and do not currently have access to the original study it is affiliated (if there is one). The only information provided about sources on the dataset's Kaggle page is, "I scraped Wikipedia pages of Atlantic hurricanes of Categoris 1,2,3 and 5 using pandas/html" (Liamtsau, 2022). With that said, it seems as though Liamtsau (2022) has collected the data and compiled it into a dataset but not engaged in a formal, 'original' study of it that can be located on Kaggle (Liamtsau, 2022). This dataset provides insights into Atlantic hurricanes, hurricanes that developed in the Atlantic Ocean area, across a 100 year time period, from 1920 to 2020. This dataset lists hurricanes that fall under the Category 1, Category 2, Category 3, and Category 5 classifications; therefore, it doesn't include Category 4 hurricanes nor does it include (storms that didn't develop beyond) tropical storms and tropical depressions. 458 hurricanes or observations/rows are included in this dataset. There are 10 variables; at this stage, many of them read as character values even though some will need to be transformed into numeric, date, and time variables in forthcoming sections of this project. Variables in the original version of the data are: - ...1 or X (or the list number/ID of the hurricane as entered into the dataset, mostly used for organizational, data entry purposes--numeric value)- the name of the hurricane (character value), - the duration of the hurricane/the dates that it occurred (character value),- the wind speed of the hurricane (in miles per hour and kilometers per hour) (character value),- the pressure of the hurricane (in atmospheric pressure-hPa and in inch of mercury-inHg) (character value),- the number of deaths caused by the hurricane (character value),- the amount of damage in US dollars caused by the hurricane (character value),- the category of the hurricane (Cat 1, 2, 3, or 5) (numeric value),- the numerically assigned references/footnotes that provide further information about the hurricane (character value)## Research Questions for Data Visualization and AnalysisMy initial exploration of the dataset has produced the following questions that I'd like to analyse more in depth in the data visualization section after the data cleaning process:- Research Question 1: Does a hurricane's max wind speed (mph) have any correlation with its max pressure measure (hPa)?- Research Question 2: Is the max wind speed measure a determining factor of hurricane category classification?- Research Question 3: Are hurricanes getting more expensive? Is the dollar unit of damage costs per hurricane rising over the years?- Research Question 4: Is there a relationship between number of deaths and a hurricane's damage cost(adjusted to millions USD)? Do hurricanes of higher categories cause more deaths? Do hurricanes of higher categories have higher damage costs?- Research Question 5: Do hurricanes with a higher max Category have a longer duration (in days)? Do hurricanes of higher categories cause more deaths? Do hurricanes of higher categories have higher damage costs?- Research Question 6: Which areas listed in the Land.areas.affected column are susceptible to the most hurricanes?## Data Cleaning Part 1### 1. Removing REf Column and the ...1 or X ColumnI am removing the REf column because I am unclear on what it represents, and I do not believe it will be useful for my purposes in tidying and working towards analyzing the snapshot this dataset provides into Atlantic hurricanes more broadly. I believe REf is potentially referring to listed/numbered footnote references from the Wikipedia pages (Liamtsau, 2022). I am removing the ..1/X column as well because this is simply the list/ID number of each hurricane as it is entered into the dataset, and since R Studio maintains its own list/ID number on the far left of the table I believe the X variable is no longer necessary. Also, since the first number in the X column is 0 for the first hurricane listed instead of 1, this can be confusing for some readers whose numbering convention starts with 1. Scrolling all the way to the end of the table (page 46 for me), we can see that the last value listed in the X column is 457, which is a slight mismatch from the 458 rows/observation values, which represented the total number of hurricanes included in the study, that R computed the dataset to have.```{r}# remove column named REf and the X Columnatlantic_hurricanes2 <- atlantic_hurricanes %>%select(-c(...1,REf))atlantic_hurricanes2 ```Looks like the REf and X (or ...1) columns were successfully removed! There should now be 8 columns.### 2. Separate Wind.speed into Wind.speed.mph and Wind.speed.kmh and Pressure into Pressure.hPa and Pressure.inHgIn the current version of the dataset, within the Wind.speed column, values for each hurricane's wind speed are provided in miles per hour (mph) and kilometers per hour (km/h) in the same cell. Likewise, values for each hurricane's pressure are provided in hPa (atmospheric pressure) and inHg (inch of Mercury). I would like to separate those values, so each unit of measurement for the wind speed and pressure, respectively has their own distinct columns.```{r}# separate the Wind.speed column into Wind.speed.mph and Wind.speed.kmhatlantic_hurricanes3 <-separate(atlantic_hurricanes2, `Wind speed`, into =c("Wind.speed.mph", "Wind.speed.kmh"), sep ="\\(")atlantic_hurricanes3``````{r}# separate Pressure column into Pressure.hPa and Pressure.inHgatlantic_hurricanes4 <-separate(atlantic_hurricanes3, Pressure, into =c("Pressure.hPa", "Pressure.inHg"), sep =" ")atlantic_hurricanes4```Looks like each unit of measurement for a hurricane's wind speed (Wind.speed.mph and Wind.speed.kmh) and a hurricane's pressure (Pressure.hPa and Pressure.inHg) now have their own distinct columns!### 3. Removing measurement unit abbreviations and unneeded parentheses from values in the Wind.speed.mph, Wind.speed.kmh, Pressure.hPa, and Pressure.inHg columnsI would like to remove the measurement unit abbreviations and unneeded parentheses from values in the Wind.speed.mph, Wind.speed.kmh, Pressure.hPa, and Pressure.inHg columns so that only the numbers/numeric values remain. Once R reads these columns as have numeric values, I'll be able to run summary statistics and other relevant numeric related functions using them that'll provide useful information to analyze.```{r}# removing "mph" from the end of values in the Wind.speed.mph columnatlantic_hurricanes5 <-mutate(atlantic_hurricanes4, Wind.speed.mph =as.numeric(str_extract(Wind.speed.mph,pattern="[:digit:]+")))atlantic_hurricanes5```Looks like "mph" has been removed from the end of Wind.speed.mph values!```{r}# removing "km/h)" from the end of values in the Wind.speed.kmh columnatlantic_hurricanes6 <-mutate(atlantic_hurricanes5, Wind.speed.kmh =as.numeric(str_extract(Wind.speed.kmh,pattern ="[:digit:]+")))atlantic_hurricanes6```Looks like "km/h)" has been successufully removed from the end of Wind.speed.kmh values!```{r}# removing commas from values in Pressure.hPa# removing "hPa" from the end of values in the Pressure.hPa columnatlantic_hurricanes7<-mutate(atlantic_hurricanes6, Pressure.hPa =str_remove(Pressure.hPa, ","),Pressure.hPa=as.numeric(str_extract(Pressure.hPa,pattern ="[:digit:]+")))atlantic_hurricanes7```Looks like commas and the hPa abbreviation have been successfully removed from the Pressure.hPa values!### Tidying the Areas column```{r}#changing areas column into areas affectedn_areas_max <-max(str_count(atlantic_hurricanes7[!is.na(atlantic_hurricanes7$`Areas affected`),]$`Areas affected`, "[a-z],"))+2#separate areas affected into multiple columns then pivot longer into one column, called areaatlantic_hurricanes8 <- atlantic_hurricanes7 %>%separate(`Areas affected`, into =paste0("a",1:n_areas_max), sep =",") %>%pivot_longer(c(a1,a2,a3,a4,a5,a6,a7,a8,a9,a10,a11),names_to ="del", values_to="area") %>%select(-del)%>%filter(!is.na(area))atlantic_hurricanes8# creating csv file of most-current version of the dataset to read into Google Sheets to make small editswrite_csv(atlantic_hurricanes8, "atlantic_hurricanes8.csv")```Looks like the areas affected column has been successfully pivoted longer into the area column where each area should have its own distinct cell! In addition, looks like we've also been able to use the write_csv() function to create a csv file of the most current version of the dataset up to this point (working with the atlantic_hurricanes8 data table). This will be imported into Google Sheets so that minor formatting changes to remove special characters and to separate two or more affected areas that previously did not have spaces in between them more succinctly than I know how to do so in R!## Reading Back in the Data Set after manually changing small things in Google SheetsI made a few minor changes to the atlantic_hurricanes8 dataset in Google Sheets such as removing cross signs (a special character) from the end of some duration dates, changing the dashes in the duration column from double dash (--, a special character) to a single dash (-), duplicating rows to separate two or more different affected areas that previously were not listed with spaces between them and changing the name of the Category column to Max.category.```{r}# reading back in data set after manually changing some small things in Google Sheetsatlantic_hurricanes9 <-read_csv("_mysampledatasets/atlantic_hurricanes8_GoogleSheetsVersion.csv")atlantic_hurricanes9```Looks like we've successfully read back in the dataset after making some small formatting adjustments in Google Sheets!## Data Cleaning Part 2### Removing Wind.speed.kmh and Pressure.inHg columns, extracting Start_Date from the Duration column and renaming Wind.speed.mph to Max.wind.speed.mph and Pressure.hPa into Max.pressure.hPa```{r}# Deleting Wind.speed.kmh and Pressure.inHg columns so that there's only one measure for wind speed (mph) and one measure for pressure (hPa)atlantic_hurricanes10 <- atlantic_hurricanes9 %>%select(-c(Wind.speed.kmh, Pressure.inHg))atlantic_hurricanes10# Extracting Start_Date from the Duration columnatlantic_hurricanes11 <- atlantic_hurricanes10 %>%mutate(Start_Date=str_c(str_extract(Duration,"[:alpha:]+ [:digit:]+(?=,)"),str_extract(Duration,", [:digit:]+")))atlantic_hurricanes11# renaming Wind.speed.mph to Max.wind.speed.mph and Pressure.hPa to Max.pressure.hPaatlantic_hurricanes12 <- atlantic_hurricanes11 %>%rename(Max.wind.speed.mph=Wind.speed.mph)%>%rename(Max.pressure.hPa=Pressure.hPa)atlantic_hurricanes12```Looks like Wind.speed.kmh and Pressure.inHg were removed successfully!### Tidying the Deaths column: changing "None" values to 0 and "Unknown" values to NA and changing Deaths column to read as a numeric value```{r}# change values that read in Deaths column as "None" to the number 0atlantic_hurricanes12$Deaths <-str_replace(atlantic_hurricanes12$Deaths, "None", "0")atlantic_hurricanes12# change values in Deaths column that read as "Unknown" to NAatlantic_hurricanes12$Deaths <-na_if(atlantic_hurricanes12$Deaths, "Unknown")atlantic_hurricanes12# change values in Deaths column that contain >1,000 to NAatlantic_hurricanes12$Deaths <-na_if(atlantic_hurricanes12$Deaths, ">1,000")atlantic_hurricanes12# change Deaths column to read as a numeric variableatlantic_hurricanes13 <-transform(atlantic_hurricanes12, Deaths =as.numeric(Deaths))atlantic_hurricanes13```As expected, looks like the Deaths column now reads as a numeric variable and the "None" value has been switched to 0 and the "Unknown" value has been switched to NA!### Tidying the Damage columnCurrently, there are a handful of values in the Damage column that will not make for the clearest analysis. All of the values contained in the Damage column can be seen when running the unique () function, which I will do below. I will change values that do not make for the clearest analysis/are less straightforward to NA. I will also remove the dollar signs, assuming that the creator of this dataset used USD for all monetary values. This is part of the process of having Damage eventually read as a numeric variable--so I can compute summary statistics and do visualizations off of the dollar amount. Like the Deaths column, there is also a value in the Damage column called "None" but instead of changing that to 0 I will be changing that to NA because I find it hard to believe that a hurricane (even of a lower intensity) caused zero damage (as a qualitative descriptor) and/or $0 worth of damage as a more quantitative descriptor.```{r}# checking for all unique values in the Damage columnunique(atlantic_hurricanes13$Damage)``````{r}# changing less clear/straightforward values in Damage column to NAatlantic_hurricanes13$Damage[startsWith(atlantic_hurricanes13$Damage, ">")] <-NAatlantic_hurricanes13$Damage[startsWith(atlantic_hurricanes13$Damage, "[")] <-NAatlantic_hurricanes13$Damage[startsWith(atlantic_hurricanes13$Damage, "M")] <-NAatlantic_hurricanes13$Damage[startsWith(atlantic_hurricanes13$Damage, "H")] <-NAatlantic_hurricanes13$Damage[startsWith(atlantic_hurricanes13$Damage, "U")] <-NAatlantic_hurricanes13$Damage[startsWith(atlantic_hurricanes13$Damage, "None")] <-NAatlantic_hurricanes13$Damage[startsWith(atlantic_hurricanes13$Damage, "E")] <-NAatlantic_hurricanes13$Damage[startsWith(atlantic_hurricanes13$Damage, "13")] <-NAatlantic_hurricanes13$Damage[startsWith(atlantic_hurricanes13$Damage, "5")] <-NA``````{r}atlantic_hurricanes14 <- atlantic_hurricanes13atlantic_hurricanes14unique(atlantic_hurricanes14$Damage)```Looks like all of the less clear/less straightforward values in the Damage column have been removed!```{r}# separating Damage into Damage.amount and Damage.unitatlantic_hurricanes15 <- atlantic_hurricanes14%>%separate(Damage, c("Damage.$.amount", "Damage.$.unit"), " ")atlantic_hurricanes15# removing $ dollar sign from Damage.$.amount column, making Damage.$.amount column a numeric variableatlantic_hurricanes15$`Damage.$.amount`=as.numeric(gsub("\\$", "", atlantic_hurricanes15$`Damage.$.amount`))atlantic_hurricanes15```Looks like the Damage column has been separated into two different columns, and the Damage.$.amount column is now a numeric variable!### Revisiting/Further Cleaning the area columnI'd like to change "No land areas" and "None" values within the area column to NA; with that said, in order to make that change, I think it's fitting to rename the area column to Land.areas.affected, so NA in that case could mean the land areas affected were/are unknown or there were no land areas affected, as in the hurricane system only remained in open waters and did not formally make landfall at any land-based location/territory.```{r}# Renaming area to Land.areas.affectedatlantic_hurricanes16 <- atlantic_hurricanes15 %>%rename(Land.areas.affected=area)atlantic_hurricanes16# viewing all unique values in Land.areas.affectedunique(atlantic_hurricanes16$Land.areas.affected)# changing "None" and "No land areas" and "No Land Areas" to NAatlantic_hurricanes16$Land.areas.affected[startsWith(atlantic_hurricanes16$Land.areas.affected, "None")] <-NAatlantic_hurricanes16$Land.areas.affected[startsWith(atlantic_hurricanes16$Land.areas.affected, "No land areas")] <-NAatlantic_hurricanes16$Land.areas.affected[startsWith(atlantic_hurricanes16$Land.areas.affected, "No Land Areas")] <-NA#re-checking for NA in Land.areas.affected columnatlantic_hurricanes17 <- atlantic_hurricanes16atlantic_hurricanes17unique(atlantic_hurricanes17$Land.areas.affected)```Looks like modifications to the Land.areas.affected column were made successfully as expected!## Summary Statistics### summary stats about Max.wind.speed.mph```{r}# summary stats about Max.wind.speed.mphsummary(atlantic_hurricanes17$Max.wind.speed.mph)```### summary stats about Max.pressure.hPa```{r}#summary stats about Max.pressure.hPasummary(atlantic_hurricanes17$Max.pressure.hPa)```### summary stats about Deaths```{r}#summary stats about Deathssummary(atlantic_hurricanes17$Deaths)```### summary stats about Land.areas.affected```{r}# summary stats about total number of distinct land areas affectedatlantic_hurricanes17%>%summarise(count =n_distinct(Land.areas.affected))# summary of how many times each land area was featuredtable(atlantic_hurricanes17$Land.areas.affected)```### summary stats about Max.category```{r}# summary stats about total number of distinct Max categories featuredatlantic_hurricanes17%>%summarize(count =n_distinct(Max.category))# summary stats about how many times each distinct Max category is featuredtable(atlantic_hurricanes17$Max.category)```### summary stats about Name```{r}#summary stats about total number of distinct hurricane names featuredatlantic_hurricanes17%>%summarize(count =n_distinct(Name))#summary stats about how many times each hurricane name was featured-->there are repeats because of how we pivoted land areas affected earlier but also hurricane names are periodically recycledtable(atlantic_hurricanes17$Name)```### summary stats about Damage.$.units```{r}# summary stats number of distinct Damage.$.unitsatlantic_hurricanes17%>%summarise(count =n_distinct(`Damage.$.unit`))# summary stats of each Damage.$.units featured-->should show that most of the hurricanes cost in the millions rangetable(atlantic_hurricanes17$`Damage.$.unit`)```## Data Cleaning Part 3### Removing the 1st Attempt of the Start_Date ColumnIn the midst this project, I found that the date(s) listed within this first attempt of a Start_Date column were actually the end dates of the hurricanes. With that said, we found an alternate way to tidy and re-purpose information from the Duration column in the forthcoming step, so we no longer have need for this Start_Date column```{r}#Removing the 1st attempt of the Start_Date columnatlantic_hurricanes17_1<-atlantic_hurricanes17%>%select(-c(Start_Date))atlantic_hurricanes17_1```Looks like the first attempt of the Start_Date column was successfully removed!### Tidying the Complicated Dates in the Duration column```{r}# Tidying the complicated dates in the Duration columnatlantic_hurricanes17_2 <- atlantic_hurricanes17_1%>%mutate(# extract year by pulling out digits of length 4 preceded by a commayear=as.numeric(str_extract(Duration,"(?<=, )[:digit:]{4}")), #extract# remove year from Duration columnDuration=str_remove(Duration,", [:digit:]{4}"),# extract start month by pulling out alpha characters preceded by a space and digitsstart_month=str_extract(Duration,"[:alpha:]*(?= [:digit:])"),# remove start month from Duration columnDuration=str_remove(Duration,"[:alpha:]*(?= [:digit:])"),# if there are still alpha numeric characters - that means there is a diff. end month# so pull that out# otherwise, start month = end monthend_month=case_when(str_detect(Duration,"[:alpha:]")~str_extract(Duration,"[:alpha:]+"),TRUE~start_month ),# remove end monthDuration=str_remove(Duration,"[:alpha:]+"),# remove all spacesDuration=str_remove_all(Duration," "),# pull out start daystart_day=str_extract(Duration, "[:alpha:]*[:digit:]{1,2}"),# now pull out end day by figuring out if there are numbers following a dash# otherwise, start day and end day are the sameend_day=case_when(str_detect(Duration,"-")~str_extract(Duration,"(?<=-)[:digit:]{1,2}"),TRUE~start_day )) atlantic_hurricanes17_2```Looks like all the date components (year, start_month, end_month, start_day, end_day) we need to make start date and end date columns have been mutated into separate, neater columns, sans dashes and spaces that characterized the former Duration column!### Making Start Date and End Date Columns```{r}# making start_date and end_date columnsatlantic_hurricanes17_3 <- atlantic_hurricanes17_2%>%mutate(atlantic_hurricanes17_2, start_date=paste(start_month,start_day,year))atlantic_hurricanes17_3atlantic_hurricanes17_4 <- atlantic_hurricanes17_3%>%mutate(atlantic_hurricanes17_3, end_date=paste(end_month,end_day,year))atlantic_hurricanes17_4```Seems like I was able to successfully create start_date and end_date columns from mutating data from the start_day, start_month, end_day, end_month, and year columns!### Making Start Date and End Date Columns into a Tidy Date Format```{r}# changing start_date and end_date into a tidy date formatatlantic_hurricanes17_5 <- atlantic_hurricanes17_4 %>%mutate(start_date =mdy(start_date))atlantic_hurricanes17_5atlantic_hurricanes_17_6 <- atlantic_hurricanes17_5 %>%mutate(end_date=mdy(end_date))atlantic_hurricanes_17_6```Seems like now the start_date and end_date columns have been changed from reading as a character type to now reading as a cleaner date type!### Removing Old Duration Column + Making New Duration Column with Number of Days between Start and End Dates```{r}#removing old/original duration columnatlantic_hurricanes_17_7 <- atlantic_hurricanes_17_6%>%select(-c(Duration))atlantic_hurricanes_17_7# creating new duration_in_days columnatlantic_hurricanes_17_8 <- atlantic_hurricanes_17_7%>%mutate(duration_in_days= end_date - start_date)atlantic_hurricanes_17_8```Seems like the old/original Duration column has been removed and the new duration_in_days column properly shows the number of days between the start_date and end_date of each observation!This column now also reads as a time value (versus a character value), so even though it's not numeric, in the forthcoming sections, I should still be able to use its data for summary statistics and visualization purposes.### Making a damage_millionsUSD columnMaking the damage dollar amounts all the same unit (converting the thousands and billions into millions)```{r}# making a damage_$millionsUSD columnatlantic_hurricanes_17_8$damage_millionsUSD <-paste(atlantic_hurricanes_17_8$`Damage.$.amount`, atlantic_hurricanes_17_8$`Damage.$.unit`)atlantic_hurricanes_17_8# making all units into their proper number formatatlantic_hurricanes_17_9 <- atlantic_hurricanes_17_8%>%mutate(damage_millionsUSD=case_when(str_detect(damage_millionsUSD, "million") ~as.numeric(str_extract(damage_millionsUSD, "[\\d\\.]+")) *1000000,str_detect(damage_millionsUSD, "thousand") ~as.numeric(str_extract(damage_millionsUSD, "[\\d\\.]+")) *1000,str_detect(damage_millionsUSD, "billion") ~as.numeric(str_extract(damage_millionsUSD, "[\\d\\.]+")) *1000000000 ))atlantic_hurricanes_17_9# converting all numbers in damage_millionsUSD to millions (in compressed format without all the zeroes at the end)atlantic_hurricanes_17_9[c("damage_millionsUSD")] <- atlantic_hurricanes_17_9[c("damage_millionsUSD")]/1e6atlantic_hurricanes_17_9# renaming damage_millions column to damage_costnames(atlantic_hurricanes_17_9)[names(atlantic_hurricanes_17_9) =='damage_millions'] <-'damage_cost'atlantic_hurricanes_17_9```Seems like there's now a damage_millionsUSD column where all the damage cost values (once in assorted thousands, millions, and billions units) have all been adjusted to being numbers in the millions unit.### Changing Start Day and End Day from Character value to Numeric value```{r}# changing start_day and end_day columns to read as having numeric valuesatlantic_hurricanes_17_10 <- atlantic_hurricanes_17_9%>%mutate(start_day=as.numeric(start_day), end_day=as.numeric(end_day))atlantic_hurricanes_17_10```Seems like the start_day and end_day variables now have numeric values!## Pairing down the number of years from 1920-2020 down to 2000-2020 for visualization and analysis purposesBecause performing certain visualizations with a century's worth of data could produce a lot of small, perhaps illegible data points and figures, I'm pairing down the dataset to focus only on data from the years 2000-2020 and later on sometimes 2015-2020, to pull from a fitting amount of data for each graph while still hopefully producing readable visuals. Additionally as someone born in the late 1990s and from a hurricane-prone area, I am more familiar with the more contemporary hurricanes (factors that shaped their buildups and realities that characterize their aftermaths) that occurred in the past 20 or so years.```{r}# Editing down to only focus on years 2000-2020atlantic_hurricanes_17_11 <- atlantic_hurricanes_17_10[atlantic_hurricanes_17_10$year >="2000"& atlantic_hurricanes_17_10$year <="2020",]atlantic_hurricanes_17_11```Seems like the dataset has been successfully edited down to data on hurricanes from 2000-2020. Working with a smaller amount of data will be conducive for visualization purposes.# Data Visualizations and Analysis## RQ1: Does a hurricane's max wind speed (mph) have any correlation with its max pressure measure (hPa)?### Scatterplot of Correlation between Max.wind.speed.mph and Max.pressure.hPa```{r}# Scatterplot of Correlation between Max.wind.speed.mph and Max.pressure.hPaggplot(atlantic_hurricanes_17_11, aes(x= Max.wind.speed.mph, y= Max.pressure.hPa))+geom_point(size=1, fill="navy", color="navy")+labs(title ="Scatterplot of Correlation between Max.wind.speed.mph & Max.pressure.hPa", subtitle ="2000-2020", x=" Max Wind Speed (mph)", y="Max Pressure (hPa)")+theme(axis.text.x =element_text(angle =30, size =2))+facet_grid()+theme_minimal()```For the most part, it seems as though as Wind Speed (mph) increases, Pressure (hPa) decreases--meaning that more severe hurricanes (with higher wind speeds and potentially higher category classification) tend to have lower pressure (hPa) measures. The Weather Channel (2019) confirms the findings from our plot, elaborating, "In general, a lower pressure means a more intense hurricane in terms of its winds and overall destructive potential. Conversely, a higher pressure indicates a weaker system" (The Weather Channel, 2019).## RQ2: Is the max wind speed measure a determining factor of hurricane category classification?### Bar Plot of Max Category by Max.wind.speed.mph sorted by Hurricane Name, 2015-2020```{r}#pair down to storms between 2015-2020atlantic_hurricanes_17_12 <- atlantic_hurricanes_17_11[atlantic_hurricanes_17_11$year >="2015"& atlantic_hurricanes_17_11$year <="2020",]atlantic_hurricanes_17_12# factor Max.categoryatlantic_hurricanes_17_12$Max.category <-factor(atlantic_hurricanes_17_12$Max.category, levels =c("1", "2", "3", "5"))# bar plot of Max.category by Max.wind.speed.mph sorted by Hurricane Nameggplot(atlantic_hurricanes_17_12, aes(x= Max.category, y= Max.wind.speed.mph, fill= Name))+geom_bar(stat ="identity", position=position_dodge(width = .6), width =0.4)+labs(title ="Bar Plot of Max Category by Max Wind Speed sorted by Hurricane Name", subtitle="2015-2020", x="Max Category (no storms w/ max Cat.1 these years)", y="Max Wind Speed (mph)", fill="Hurricane Name")+facet_grid()+theme_light()```Between 2015-2020, it seems as though a majority of storms (16 out of 22 or 8/11ths) of hurricanes were either Category 2 or Category 3. With that said, 6 out of 22 or 3/11ths of hurricanes from 2015-2020 became Category 5 storms. From this it can be gathered that 2015-2020 produced a somewhat high amount of named hurricanes with relatively high max category classifications (as stated in the chart, there were no storms with a max category of 1 in these years). From the bar plot, it seems as though there is a clear segmentation of (max) hurricane category by max wind speed (mph). Category 2 hurricanes depicted seemed to have a max wind speed slightly over 100mph; whereas Category 3 storms had wind speeds equivalent to or stretching towards 125 mph. Category 5 hurricanes during this time period had slightly more variation in their max wind speeds; the highest being Hurricane Dorian, a 2019 storm recorded to reach winds of up to 185 mph. This visualization's findings are congruent with the basis of the Saffir-Simpson Hurricane Wind Scale also known as the Saffir-Simpson Scale, the official classification system for hurricane categories. According to the National Hurricane Center (n.d.), "The Saffir-Simpson Hurricane Wind Scale is a 1 to 5 rating based only on a hurricane's maximum sustained wind speed. This scale does not take into account other potentially deadly hazards such as storm surge, rainfall flooding, and tornadoes" (National Hurricane Center, n.d.). The National Hurricane Center (n.d.) lists "Sustained Winds" ranges for each of the categories:Category 1 "74-95 mph", Category 2 "96-110 mph", Category 3 "111-129 mph", Category 4 "130-156 mph",and Category 5 "157 mph or higher" (National Hurricane Center, n.d.). We can see that our data from the Max.wind.speed.mph variable corresponds well with(in) these established ranges.## RQ3: Are hurricanes getting more expensive? Is the dollar unit of damage costs per hurricane rising over the years?### Line Plot of Hurricane Count over the Years, 2000-2020, sorted by Damage dollar unitBecause of how we pivoted the data wider earlier on in the cleaning process so that each row can have its own land area affected, the data table as is repeats hurricane names and affiliated info about each hurricane (all variables except Land.areas.affected) for each hurricane. It is important to be mindful of this in the visualization section, especially in visuals where we are plotting hurricane count, because we don't want skewed data saying that there's a higher amount of hurricanes than there actually were. For example, 1 hurricane may have impacted 4 different areas, so there are 4 rows with the same hurricane and the only differentiating characteristic between those 4 rows is what's listed in each their respective cells in the Land.areas.affected column. With that said by inputting the Name variable within the unique() and n_distinct() functions before creating the line plot, we should hopefully get the 'official' hurricane count per damage dollar unit per year, as in without skewed figures due to the repetition of hurricane names.```{r}# Line Plot of Hurricane Count over the Years, 2000-2020, sorted by Damage.$.unit# using group by and summarize to get count of hurricanes per year and per Damage.$.unit and using unique() and n_distinct() so that hurricane names don't repeatatlantic_hurricanes_17_13 <- atlantic_hurricanes_17_11 %>%group_by(year, `Damage.$.unit`, Name) %>%summarize(unique_hurricanes=unique(Name), n_distinct(Name))%>%summarize(count=n())atlantic_hurricanes_17_13# making the line plotggplot(data = atlantic_hurricanes_17_13, aes(x= year, y= count, color=`Damage.$.unit`))+geom_line(size=1)+facet_grid()+ylim(0,7)+labs(title="Line Plot of Hurricane Count over the Years sorted by unit of Damage Cost ($USD)", subtitle="2000-2020", x="Year", y="Hurricane Count", color="Damage.$.unit")+theme_light()```Much like earlier versions of our dataset that spanned from 1920-2020, we can see that a considerable amount of storms in the last 20 years captured by the dataset have damage cost amounts and dollar units that read as NA--so this dataset and this line plot do not give us the most comprehensive and precise information in the realm of tracking hurricane damage costs across time. It should be noted that just because the damage costs for a hurricane are listed as NA in this dataset, does not mean a hurricane didn't actually cause a hefty and highly expensive amount of damage in the thousands, millions, or billions of dollars. To me, the relatively high prevalence of NA values in the damage dollar amount and damage dollar unit variables across this dataset evidences that precisely calculating the monetary damage incurred by a hurricane is an increasingly complex task. Even with the experiences and logged estimates from prior storms, such monetary figure is prone to high uncertainty and constant fluctuation, especially with storms that span across states, regions, and countries--and even those that remained confined to a smaller area. Many things can become damaged in the event of a hurricane, so there's always a myriad of components to consider in what constitutes the cost of damage. Moreover, qualifying hurricane damage in solely quantitative terms/metrics doesn't paint the full picture, but, on the other hand, working with solely qualitative descriptors of damage can potentially become too subjective. Some of the values in the original DamagesWith that said, from how the line plot displays the non-NA Damage dollar units of thousand, million, and billion, we can deduce that the dollar unit of hurricane damage costs have incurred significant changes between 2000-2007 but remained relatively stable post 2008 or so. In 2000, there were the same amount of hurricanes that cost in the thousands and hurricanes that cost in the millions (1 of each). Moreover, in 2000 there were zero recorded storms costing in the billions of dollars worth of damage. Shortly thereafter, this changes--by 2005, hurricanes costing millions of dollars outpace hurricanes costing in the thousands of dollars by 2 to 1 (they would briefly go back to having an equal count in 2006). Shortly after 2005 (seemingly with an 'end-point' of sorts in 2006 according to the data table), there are no further recorded hurricanes with damage costs remaining within the thousands of dollars. Furthermore, slightly after the midpoint between 2000 and 2005 (in 2003 according to the data table), we are introduced to hurricanes that incur damage costs in the billions of dollars, and the following years (to 2020) have mostly continued to produce storms that cost in the billions of dollars. According to the grouped data table, in 2005, there were 14 hurricanes total--half of them read as NA, meaning we have no damage dollar costs/unit info available. Of the 14, five were hurricanes costing in the billions of dollars--the highest count for the billions unit recorded in the data from 2000-2020. Short of one hurricane, our findings are largely consistent with Pradhan (2022), who writes, "Based on historical records and facts, the 2005 season was the most destructive when 28 named storms were recorded, 15 of which were hurricanes" (Pradhan, 2022). The "Total Financial Damage" costs of "Over 172 Billion USD" that Pradhan (2022) reports for the 2005 Hurricane season compliments the visual our line plot provides of the record-high count of hurricanes with damage costs in the billions unit (Pradhan, 2022). While no year after 2005 in the dataset has produced a higher amount of total hurricanes (with max. categories of 1, 2, 3, and 5), we do see that even in more recent years with fewer total hurricanes, there are consistently hurricanes that cause damage in the billions and a little more so in the millions of dollars. ## RQ4: Is there a relationship between number of deaths and a hurricane's damage cost(adjusted to millions USD)? Do hurricanes of higher categories cause more deaths? Do hurricanes of higher categories have higher damage costs?### Scatterplot of Relationship between Deaths and damage_millionsUSD, 2000-2020 sorted by Max.category```{r}# Scatterplot of Relationship between Deaths and damage_millionsUSD, 2000-2020, sorted by Max.category# factor Max.categoryatlantic_hurricanes_17_11$Max.category <-factor(atlantic_hurricanes_17_11$Max.category, levels =c("1", "2", "3", "5"))#making the scatterplotggplot(atlantic_hurricanes_17_11, aes(x= Deaths, y= damage_millionsUSD, color=Max.category, label=Name))+geom_point(size=1)+geom_text(aes(label=ifelse(Deaths>200,as.character(Name),'')), hjust=0, vjust=0)+labs(title ="Scatterplot of Relationship between Deaths and damage_millionsUSD", subtitle ="2000-2020, sorted by Max Category", x="Deaths", y="Damage (millions USD)", color="Max Category")+theme_light()+facet_grid()+scale_y_continuous(breaks = scales::pretty_breaks(n =12))+scale_x_continuous(breaks = scales::pretty_breaks(n =16))+theme(axis.text.x =element_text(angle =30, size =8))+theme(axis.text.y =element_text(size =8))+theme(legend.position='bottom')```Given that some damage_millionsUSD and/or Deaths values read as NA for some hurricanes in the dataset, there is a considerable amount of data not represented in this scatterplot. For example, Hurricane Jeanne, a Category 3 hurricane that struck in 2004 and was estimated to have a death toll of 3037, is visible in the data table but its 'would-be' light blue point does not appear in the scatterplot because its damage_millionsUSD value reads as NA. To put the amount of 'missing data' in this visualization into perspective, while loading the graph, R returned a warning message that it "Removed 137 rows containing missing values" (R Core Team, 2023). While it is harder to fully parse out the data points that are clustered together at the start of the graph, we can see that for the most part, Category 5 hurricanes tend to produce the costliest damage in the years 2000-2020. In particular, there were two Category 5 hurricanes that produced the highest death tolls and damage counts in this time span: Hurricane Maria in 2017(claiming 3057 lives and costing 91,600 millions or 91.6 billion) and Hurricane Katrina in 2005(claiming 1836 lives and costing 125,000 million or 125 billion). With that said, we can also see that three Category 1 hurricanes, while having a slightly lower damage_millionsUSD cost than some other Category 5 and Category 3 hurricanes, did incur sizable death tolls. Looking back at the data table to identify those points, Hurricane Stan caused 1668 deaths in 2005, Hurricane Hanna caused 537 deaths in 2008, and Hurricane Noel caused 222 deaths in 2007. This proves that hurricane category in and of itself is not a firm indicator of death toll and that hurricanes, regardless of their category are severe weather systems capable of disrupting livelihoods, the flow of essential resources like power/electricity, food and clean water access, etc. Moreover, some locales/communities/populations are disproportionately more vulnerable to the conditions produced by hurricanes and the widespread disruptions they cause than others (Torani et al., 2019; So et al., 2020). To me, this small trend of three Category 1 hurricanes with high death tolls can speak to discrepancies in public perception of hurricane severity(i.e. capacity to cause death and destruction) based on category classification. Erdman (2020) of The Weather Channel, corroborates this finding, writing, "A hurricane's intensity frequently doesn't correlate to its deadly potential" (Erdman, 2020). All in all, while this visualization does provide a snapshot into the relationship between death tolls and damage costs incurred by hurricanes, it does not provide the most comprehensive picture given the amount of data within the Deaths and damage_millionsUSD variables that have NA values.## RQ5: Do hurricanes with a higher max Category have a longer duration (in days)?### Bar Plot of Hurricane Name by Duration (in days), sorted by Max.category, 2015-2020```{r}# Bar Plot Hurricane Name by Duration (in days), sorted by Max.category 2015-2020# grouping data by Name, duration_in_days, Max.categoryatlantic_hurricanes_17_12_1 <- atlantic_hurricanes_17_12%>%group_by(Name, duration_in_days, Max.category)%>%mutate(duration_in_days=as.numeric(duration_in_days))atlantic_hurricanes_17_12_1# making the Bar Plotggplot(atlantic_hurricanes_17_12_1, aes(x=Name, y=duration_in_days, fill=Max.category))+geom_bar(position="dodge", stat="unique", color="black")+labs(title ="Bar Plot of Duration by Name sorted by Max Category and Name", subtitle ="2015-2020", x=" Hurricane Name", y="Duration (in days)", fill="Max.category")+theme_light()+theme(axis.text.x =element_text(size =6))+coord_flip()```From what we can see from this horizontal bar plot of hurricanes from 2015-2020, there is a somewhat of an unclear correlation between hurricane duration (in days) and Max.category. In this visualization, several Category 2 hurricanes appear to have the longest duration in days, while Category 3 and Category 5 hurricanes during those years seem to mostly have shorter durations. For example, Hurricane Paulette occurred in 2020, reached a max Category 2 and had a duration of 16 days from September 7-September 23, 2020. In contrast, in 2018, Hurricane Michael intensified all the way to a Category 5 and had a duration of 0 days (or alternatively less than a full day) from October 10-October 10, 2018. This suggests that time/duration itself does not intensify hurricanes/raise their category; i.e., disproving the notion that a hurricane of a higher/the highest Category has to have a longer duration than a hurricane of a lower/lowest Category. It's not to say that time/duration(in days) has no influence on hurricanes and how we map, track & contextualize their broader impact; rather it is to call attention to the fact that a mix of atmospheric and environmental conditions, that are more situational in nature, such as water temperature, the presence of dry versus humid air, wind shear, the speed at which the system moves, etc more substantively influence hurricane development and intensification (National Weather Service staff, n.d.). In other words, a hurricane can intensify to a Category 5 in a short span of time given certain conditions,a tropical storm(which will have received an official 'hurricane' name) can take longer to intensify to a Category 1 hurricane given certain conditions, a hurricane can fluctuate between a Category 1 and Category 2 but not intensify beyond that given certain conditions, etc. However, this visualization does call into question how the creator of this dataset, Liamtsau (2022) and the source(s) they compiled the data from--"Wikipedia"--interpret duration (Liamtsau, 2022). How did they determine the start date and end date they provided for each hurricane in the dataset? Is the start date marking the beginning of the tropical system even before it became a hurricane? Is the end date marking the final dissipation of the system, after it has de-intensified and is no longer classified as a hurricane? Are the dates specific to when a hurricane was the Max.category it is listed at in the dataset? Are the dates specific to landfall (and landfall as a hurricane vs as a tropical storm or tropical depression)? There are a handful of possibilities as to how to create a timeframe for the duration of a storm. Since Liamtsau (2022) used information from Wikipedia to create the dataset, let's see what information regarding dates can be found on the Wikipedia page for 2018's Hurricane Michael. Under the "Meteorological history" section in the infobox at the top of the page, 3 significant dates are listed: "Formed October 7, 2018", "Extratropical October 11, 2018", "Dissipated October 16, 2018" (Wikipedia contributors, 2023). Furthermore, a line in the introduction section reads, "making landfall near Mexico Beach, Florida, on October 10, becoming the first to do so in the region as a Category 5 hurricane" (Wikipedia contributors, 2023). In less than 24 hours after landfall, Hurricane Michael de-intensified to (and subsequently 'less than') a Category 1 storm (Wikipedia contributors, 2023).This means that our dataset, which for Hurricane Michael marks a start date and end date of October 10, 2018, associates 'start date' with (first area of) official landfall and 'end date' seemingly with the last day the hurricane retained official hurricane classification before transitioning into an extratropical system. It's worthwhile to mention that a hurricane can still impact/inflict damage upon land areas without officially making landfall. Pointedly, this was the case of Hurricane Michael, which impacted Central America and Cuba before making official landfall in Florida on the Gulf Coast side (Wikipedia contributors, 2023). According to NOAA's National Weather Service- Glossary (n.d.), "Extratropical" is defined as follows: "A term used in advisories and tropical summaries to indicate that a cyclone has lost its 'tropical' characteristics. The term implies both poleward displacement of the cyclone and the conversion of the cyclone's primary energy source from the release of latent heat of condensation to baroclinic (the temperature contrast between warm and cold air masses) processes. It is important to note that cyclones can become extratropical and still retain winds of hurricane or tropical storm force" (NOAA’s National Weather Service - Glossary, n.d.). Thus, while the extratropical classification--and by extension the end dates provided in our dataset--do not mark the complete dissolution of the storm system, it marks a turning point nonetheless, i.e., when a system phases out of its "'tropical' characteristics" but can still present as an intensive weather system with hurricane-like conditions that have the capacity to impact areas, lives, etc (NOAA's National Weather Service - Glossary, n.d.).## RQ6: Which areas listed in the Land.areas.affected column are suseptible to the most hurricanes?This question will be answered with two alternate visualizations, a bar plot charting frequency and a pie chart based on calculating the proportion of each land area in the Land.areas.affected variable.## Bar Plot Frequency of Land Areas Affected by Hurricanes, 2015-2020```{r}## Bar Plot of Frequency of Land Areas Affected by Hurricanes, 2015-2020ggplot(data = atlantic_hurricanes_17_12, aes(x= Land.areas.affected))+geom_bar(width= .5, fill="darkgreen")+facet_grid()+theme(axis.text.x =element_text(angle =90, size =8))+labs(title="Bar Plot of Frequency of Land Areas Affected by Hurricanes", subtitle ="2015-2020", x="Land Areas Affected", y="Frequency")```It is important to note that this visualization and below does not provide the most precise frequency data because there is some overlap and repetition amongst values in the Land.areas.affected column in the dataset. For example, "Gulf Coast of the United States" and "United States Gulf Coast" assumingly refer to the same area but are represented as distinct character values in the data. Moreover, "Cabo Verde" and "Cape Verde" are Portuguese and English translations of the same place. In terms of overlap, the "Dominican Republic", "Haiti", "The Bahamas", "Jamaica", "Puerto Rico", and "Cuba" are all located in the Caribbean and have distinct character values, but "The Caribbean" also features as its own, distinct character value. The same can be said for Central American nations (like "Costa Rica", "Nicaragua", and "Panama") being listed as well as "Central America", and likewise, "Florida" has its own distinct value even though it is technically a state in the US Gulf Coast. During the earlier data cleaning phases of this project, the course instructor and I discussed how to make sense of this/go about cleaning it, but I ultimately decided against it as a means to not over-manipulate the original data. Lastly, another limitation of this graph and this dataset more broadly, is that it also does not account for the frequency in which hurricanes with a max Category of 4 and other tropical and extratropical systems impacted these land areas; thus, the full scope of systems that impacted land areas during Hurricane seasons 2015-2020 is not fully showcased in this data.With that said, some insights into land areas most impacted by hurricanes can still be gleaned from this bar plot as-is. From 2015-2020, Bermuda was impacted by 5 hurricanes and appears as the land area with the highest hurricane frequency. Though we'd have to look back at the data table to see how this is spread across the five years, Bermuda being hit by five hurricanes in a five year period is slightly higher than Hurricane City's (n.d.) projection that Bermuda gets "brushed or hit every 1.74 years" (Hurricane City, n.d.). Hurricane City (n.d.) does account for this increase in frequency more broadly, noting, "Activity trending up" (Hurricane City, n.d.). Next, the Azores, an archipelago that is part of Portugal, experienced 4 hurricanes during that time span (Silva, 2022). Atlantic Canada, Cuba, The Bahamas, and the United States East Coast--as listed--each experienced 3 hurricanes in the years between 2015-2020. Four out of six or two-thirds of the land areas listed as experiencing 3 to 5 hurricanes between 2015-2020 are islands/island clusters. Because Atlantic hurricanes develop in open waters, islands--especially those further away larger land masses--and situated open bodies of water (like the Atlantic Ocean, Gulf of Mexico, Caribbean Sea, etc) are uniquely susceptible to being hit by hurricanes. Donvito (2023) extends this argument in a regional Caribbean context, mentioning, "Although some experts say there’s no such thing as a 'hurricane belt,' certain islands do get hit more often due to weather patterns and trade winds. So, the northeastern Caribbean islands are more likely to be struck, with islands closer to South America less likely and worth taking the small risk of a storm" (Donvito, 2023). The Bahamas and Cuba, two of the six or one-third of the affected land areas with a high hurricane frequency are located in the Caribbean. For additional context, findings about The Bahamas and Cuba from our bar plot should be analyzed alongside a 2020 study conducted by the University of Bristol that found the Caribbean "to be particularly vulnerable to climate change, resulting in extreme hurricane rainfall events being as much as five times more likely in a warmer world" (University of Bristol, 2020; L Vosper et al., 2020).As a native of New Orleans which is situated in the Gulf Coast of the United States, I can attest to the high frequency of hurricanes and other tropic activity in this region. I thought it would be worthwhile to mention that combining the frequencies of "Gulf Coast of the United States" and "United States Gulf Coast", returns a frequency of 3 hurricanes, which would also place the US Gulf Coast region in what I'm deeming (from this bar plot) as a high frequency of hurricanes in the years of 2015-2020.### Pie Chart of Proportional Makeup of Land Areas Affected by Hurricanes, 2015-2020```{r}# Pie Chart of Proportional Makeup of Land Areas Affected by Hurricanes#getting proportion of land.areas.affectedatlantic_hurricanes_17_14 <-prop.table(table(atlantic_hurricanes_17_12[["Land.areas.affected"]]))atlantic_hurricanes_17_14# making the Pie chartpie(atlantic_hurricanes_17_14, cex=.4, main ="Pie Chart of Proportional Makeup of Land Areas Affected by Hurricanes, 2015-2020")```This pie chart doesn't provide the most precise information as it relates to proportional data of certain land areas featured in the Land.areas.affected column due to the same reasons are the bar chart above.With that said, the way in which the pie chart visualizes proportional value alloted to each land area in the Land.areas.affected column largely captures a similar understanding compared to plotting frequency and Land.areas.affected with a bar chart. Bermuda, Azores, Atlantic Canada, Cuba, The Bahamas, and the United States East Coast each seem to occupy larger-sized portions of the circle.## Conclusion/Critical Reflection/Limitations of DatasetOverall, this atlantic hurricanes dataset that I sourced from Liamtsau (2022) on Kaggle serves as an imperfect, yet extensive repository of a century's worth of valuable hurricane-related information spanning from historical to contemporary eras (Liamtsau, 2022). I think it provides insights relevant to educating the general public (especially populations across the affected land areas) in an era where its increasingly essential to be weather aware and attune to the factors influencing and being influenced by climate change. In addition, while I doubt my analyses produced any altogether novel, previously undiscovered information, I believe its information can also be reviewed by those currently fields such as meteorology, climatology & other environmental sciences, disaster and emergency management, global studies, history, statistics, regional planning and public administration, public health, social services, etc and be put in conversation with their ongoing research, work, and other efforts to build resilience before, during, and in the wake of natural disasters. On the other hand, there are some limitations to this dataset. Something I noticed this dataset doesn't answer is, at what point in the duration of the hurricane were these measures of wind speed and pressure taken? While I'm assuming it is a listing of the highest intensity recorded wind speed and pressure throughout the course of the storm, this isn't clear. Moreover, for the hurricanes that impacted multiple areas, the wind speed and pressure was likely not the exact same measure in each successive location the hurricane made landfall in. Additionally, instead of blanket/totaled/maxed and thus singular figures for most of the variables, what was the damage cost, death toll, duration, and max.category in each area affected per hurricane (understandably this creates a much larger dataset)? How could we equitably capture qualitative descriptors of the damage (as well as monetary estimates in other currencies besides USD) from impacted communities globally? While valuable insights can be deduced from this dataset--as stated previously, studying each storm and each area individually will provide additional, more full and nuanced context(s) of systems, resources, lived experiences, etc that influenced and/or were influenced by the hurricane(s).From working with this dataset that was originally created for the purpose of being a data cleaning challenge, I can confirm that I spent a sizeable amount of time doing precisely that--cleaning the data and asking questions about the best techniques and alternate ways of doing so (Liamtsau, 2022). From this I learned that attention to detail and determination to see through each stage of working with data with the intent to communicate a story with it is at the heart of a committed data scientist's work. With that said, I was able to use this dataset to gather summary statistics and explore a handful of inquiries through visualizations: the correlation between measures of max wind speed (mph) and max pressure (hPa), the relationship between max wind speed (mph) and category classification according to the Saffir-Simpson scale, trends in units of hurricane damage costs over time, the relationship between death toll and damage cost (adjusted to millions USD), the relationship between the duration of days and max category reached by a hurricane, and observances of land areas most frequently impacted by hurricanes. There are several other analyses that can be embarked on with this dataset which I did not pursue in this project but can be the basis for future work with this dataset, such as gathering summary statistics and visualizing the average start and end months to get insights into peak times within hurricane seasons across the years, using any of the map-centric graphs in ggplot to draw further attention to the land areas affected with the addition of a map backdrop, etc. ## References### Personal Communications to Ask/Answer Dataset and R-related Questions from Class, Office Hours, Slack, Github, etcA. Bertin, personal communication, July 2023.S. Conway, personal communication, June-July, 2023.S. Saluja, personal communication, June-July, 2023.### DatasetLiamtsau, V. (2022, August 5). Atlantic hurricanes (data cleaning challenge). Kaggle. https://www.kaggle.com/datasets/valery2042/hurricanes### Topically-relatedDonvito, T. (2023, January 25). 10 islands you can still visit in hurricane season. Reader's Digest. https://www.rd.com/list/islands-you-can-still-visit-in-hurricane-season/Erdman, J. (2020, September 13). Hurricane safety and preparedness| This is actually the biggest killer during hurricanes and tropical storms. The Weather Channel. https://weather.com/safety/hurricane/news/us-deaths-hurricanes-tropical-storms-nhc-studyHurricane City. (n.d.). Bermuda's history with tropical systems. Hurricane City. https://hurricanecity.com/city/bermuda.htmL Vosper, E., M. Mitchell, D., & Emanuel, K.A. (2020). Extreme hurricane rainfall affecting the Caribbean mitigated by the paris agreement goals. Environmental Research Letters, 15.National Hurricane Center (n.d.). Saffir-Simpson hurricane wind scale. National Hurricane Center. National Oceanic and Atmospheric Administration. https://www.nhc.noaa.gov/aboutsshws.phpNational Weather Service staff. (n.d.). Hurricane facts. National Weather Service. https://www.weather.gov/source/zhu/ZHU_Training_Page/tropical_stuff/hurricane_anatomy/hurricane_anatomy.htmlNOAA’s National Weather Service - Glossary. (n.d.). Extratropical. National Weather Service. https://forecast.weather.gov/glossary.php?word=extratropicalPradhan, A. (2022, March 23). 10 most active hurricane seasons. Earth & Human. https://earthandhuman.org/most-active-hurricane-seasons/Robinson, M., Coelho, D. P., & Smith, P. S. (2022). Family Health Care Nursing: Theory, Practice, and Research. Philadelphia: F.A. Davis. 7th edition.Silva, L. (2022, January 16). The 9 islands of the Azores. Portugal.com. https://www.portugal.com/region/the-9-islands-of-the-azores/So, M., Franks, J. L., Cree, R. A., & Leeb, R. T. (2020). An evaluation of the literacy demands of online natural disaster preparedness materials for families. Disaster Medicine and Public Health Preparedness, 14(4), 449–458. https://doi.org/10.1017/dmp.2019.62The Weather Channel. (2019, July 24). Top five most intense U.S. hurricanes. The Weather Channel. https://weather.com/storms/hurricane/news/2019-07-24-five-most-intense-us-hurricanes-landfalls-pressureTorani, S., Majd, P. M., Maroufi, S. S., Dowlati, M., & Sheikhi, R. A. (2019). The importance of education on disasters and emergencies: A review article. Journal of education and health promotion, 8(85), 1–7. https://doi.org/10.4103/jehp.jehp_262_18University of Bristol. (2020, August 27). Hurricanes could be up to five times more likely in the Caribbean if tougher targets are missed. ScienceDaily. Retrieved from www.sciencedaily.com/releases/2020/08/200827130612.htmWikipedia contributors. (2023). Hurricane Michael. Wikipedia. https://en.wikipedia.org/wiki/Hurricane_Michael### Technical/SoftwareHoltz, Y. (2018). The R Graph Gallery. https://r-graph-gallery.com/index.htmlR Core Team (2023). R: A language and environment for statistical computing. R Foundation for Statistical Computing, Vienna, Austria. URL https://www.R-project.org/Wickham, H., & Grolemund, G. (2017). R for data science: Visualize, model, transform, tidy, and import data. O'Reilly Media. Retrieved from https://r4ds.had.co.nz/index.html