# A tbl_graph: 30 nodes and 21 edges
#
# A rooted forest with 9 trees
#
# Node Data: 30 × 1 (active)
  name
  <chr>
1 Rocco Lampone
2 Tattaglia unknown
3 Corleone unknown
4 Michael Corleone
5 Barzini unknown
6 Fabrizio
# … with 24 more rows
#
# Edge Data: 21 × 4
   from    to `family from` ...4
  <int> <int> <chr>         <lgl>
1     1    10 Corleone      NA
2     2    11 Tattaglia     NA
3     1    12 Corleone      NA
# … with 18 more rows
I’ve created a network object with both igraph and tidygraph, just to compare the two.
The network is:
directed (one person commits the murder, the other is murdered)
named
unweighted
not bipartite
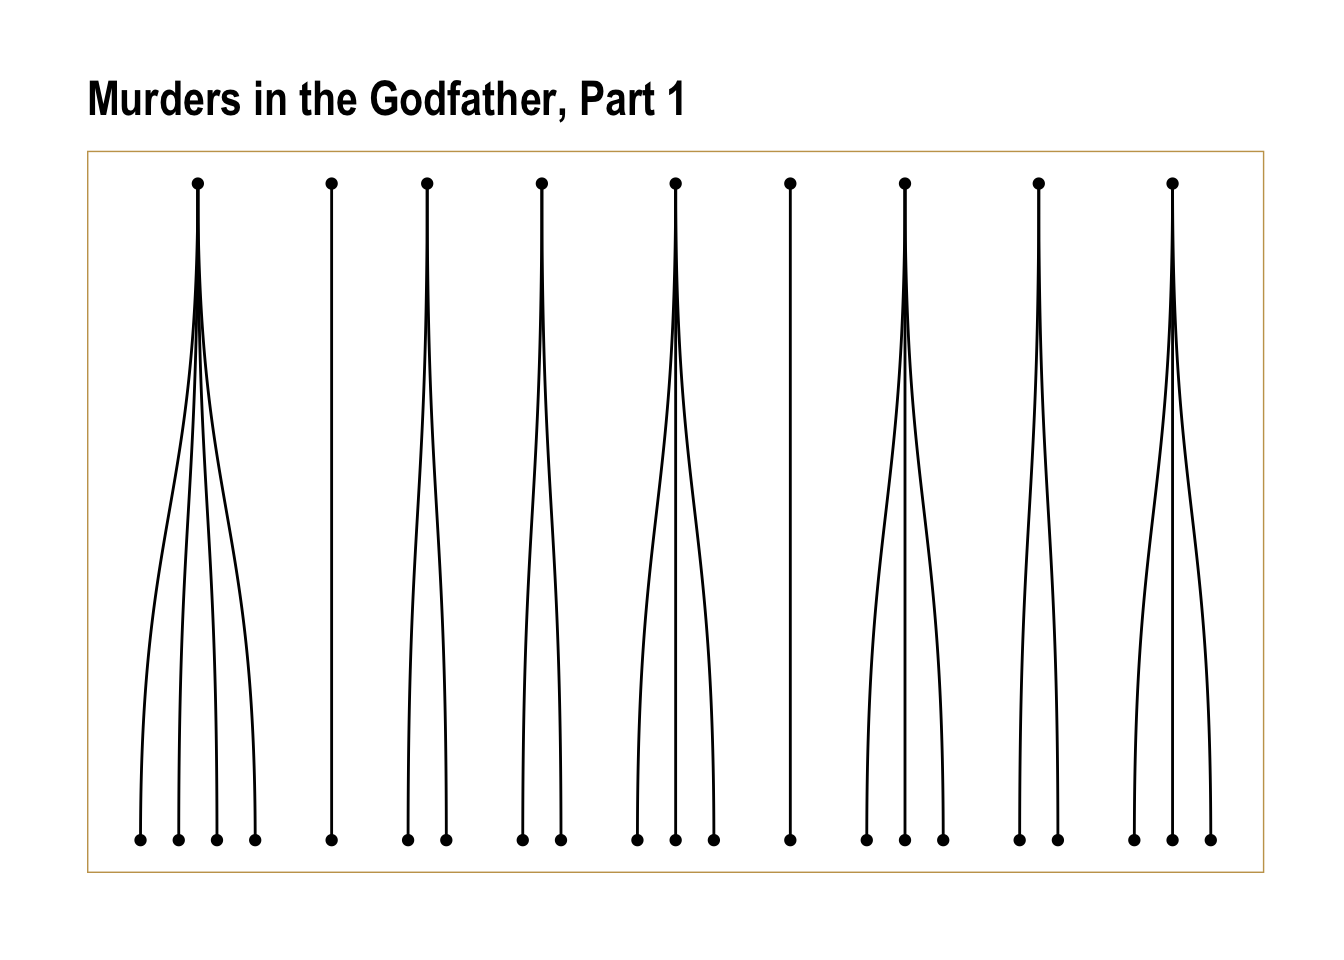
It has 30 nodes and 21 edges. The network is not connected.
Code
# get number of componentsigraph::components(murders.ig)$no
[1] 9
Code
# get size of each componentigraph::components(murders.ig)$csize
[1] 5 2 3 3 4 2 4 3 4
Code
# create plotggraph(murders_tidy, layout ="auto") +geom_node_point() +geom_edge_diagonal() +labs(title ="Murders in the Godfather, Part 1") +theme_graph(foreground ="#c6a25a")
Using "tree" as default layout
Warning: Using the `size` aesthetic in this geom was deprecated in ggplot2 3.4.0.
ℹ Please use `linewidth` in the `default_aes` field and elsewhere instead.
For this network, any node with an out-degree of anything other than zero has committed a murder while any node with an in-degree of anything other than zero was ultimately murdered. Logically we know that no node should have an in-degree of greater than zero, as one can only be murdered once.
Code
# get summarysummary(murders_nodes)
     name               degree       indegree     outdegree
 Length:30          Min.   :1.0   Min.   :0.0   Min.   :0.0
 Class :character   1st Qu.:1.0   1st Qu.:0.0   1st Qu.:0.0
 Mode  :character   Median :1.0   Median :1.0   Median :0.0
                    Mean   :1.4   Mean   :0.7   Mean   :0.7
                    3rd Qu.:1.0   3rd Qu.:1.0   3rd Qu.:1.0
                    Max.   :4.0   Max.   :1.0   Max.   :4.0
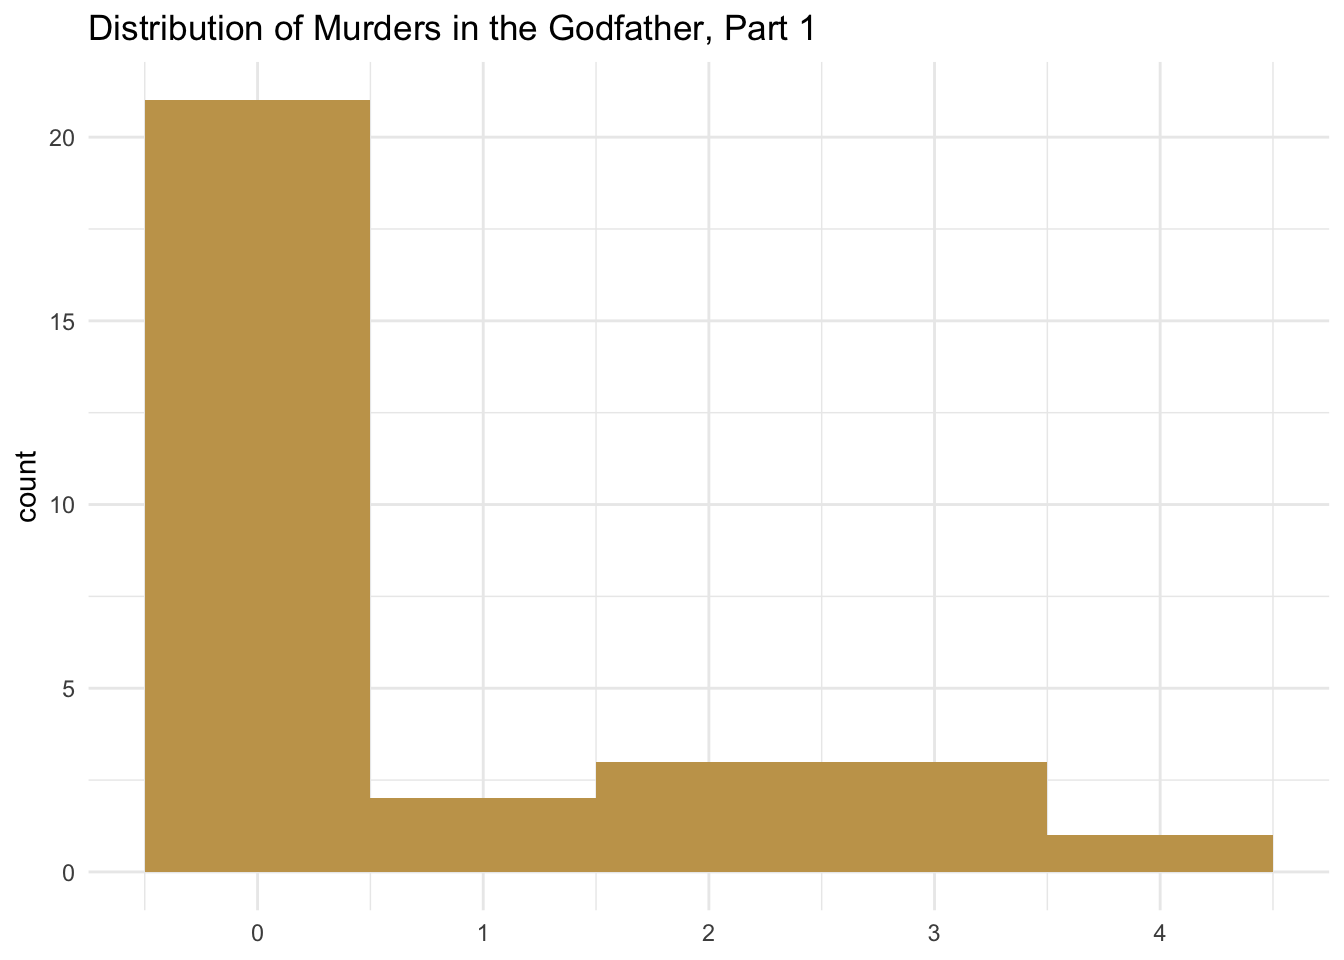
Given the logical constraints of this network, there isn’t much to revealed by the summary statistics. In the out-degree column we can see:
The maximum number of murders committed by any one person is 4.
The mean number of murders committed by all nodes is .7. This is the mean of all nodes, however, not the mean of the nodes who actually murdered someone. If we look at the out-degree distribution below, we can see that most nodes did not murder anyone and are therefore dragging the mean number of murders down significantly.
Code
# create plotggplot(murders_nodes, aes(x = outdegree)) +geom_histogram(binwidth =1, fill ="#c6a25a") +labs(title ="Distribution of Murders in the Godfather, Part 1", x =NULL) +theme_minimal()
Density
Network density is the proportion of ties present in a network of all possible ties. A complete network has a network density of “1.” [I THINK] that in this particular network a density of “1” would mean that every node both murdered someone and was ultimately murdered.
Possible ties = n(n-1)
Actual ties = (2 * # of mutual ties) + # of asymmetric ties
There are 870 possible ties and 21 actual ties.
Code
# calc density manually - FOR PRACTICEn <-30p_ties <- n * (n-1)p_ties
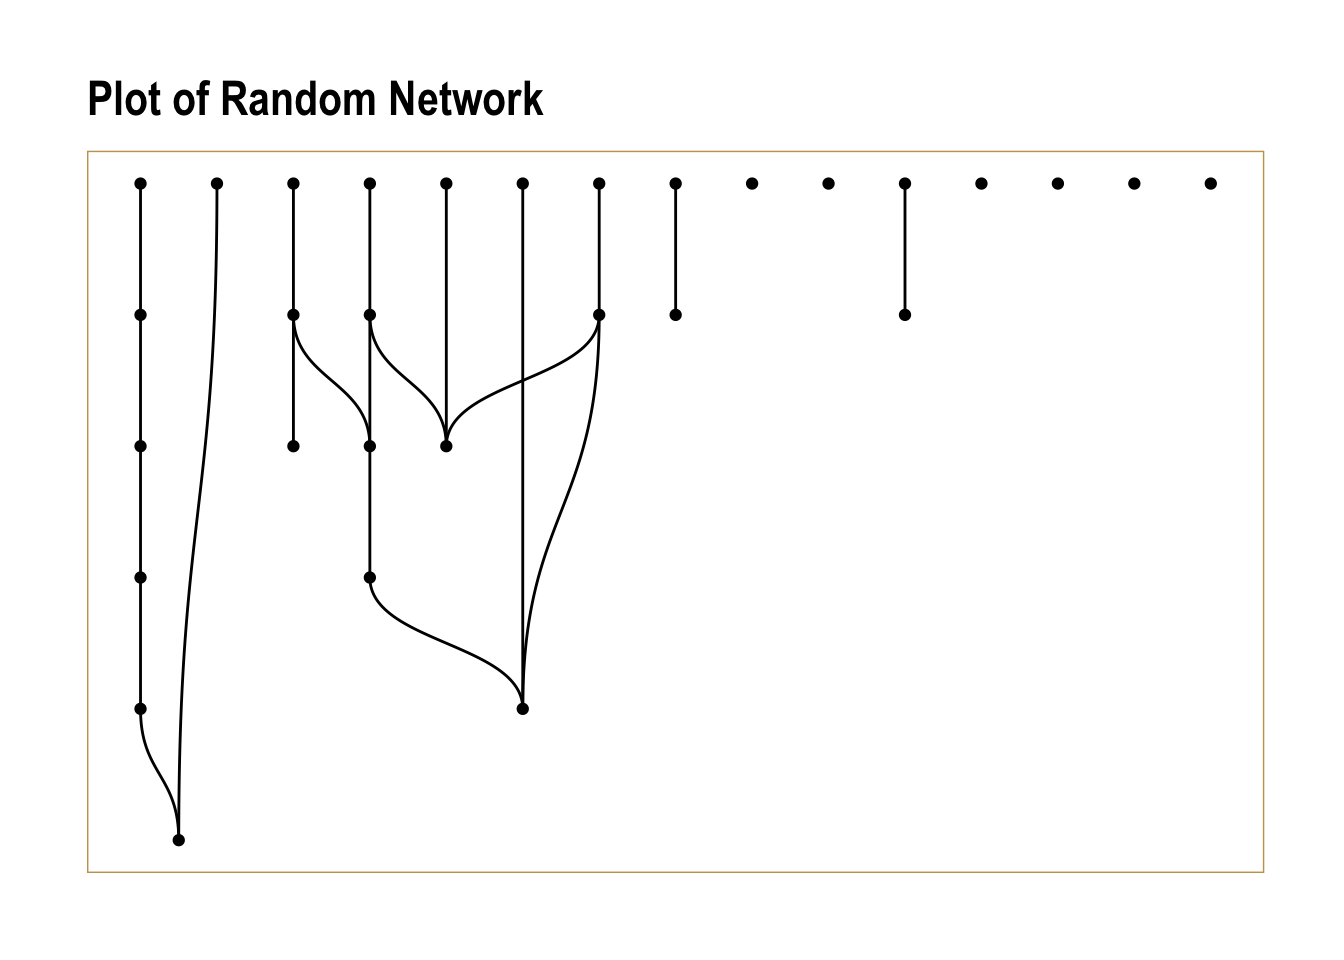
# create random networkrandom <-erdos.renyi.game(30, 21, type ="gnm", directed =TRUE)# plot random networkggraph(random, layout ="auto") +geom_node_point() +geom_edge_diagonal() +labs(title ="Plot of Random Network") +theme_graph(foreground ="#c6a25a")
Using "sugiyama" as default layout
The random network is very different from the actual network.
Source Code
---title: "Week 3 Challenge"author: "Claire Battaglia"description: "Degree and density of a network"date: "March 22, 2023"format: html: toc: true code-fold: true code-copy: true code-tools: true# editor: visualcategories: - Claire Battaglia - challenge3 - degree - density---```{r}#| label: setup#| include: falsepacman::p_load(ggplot2, tidyverse, tidygraph, ggraph, igraph)knitr::opts_chunk$set(echo =TRUE)```## Describe the network dataThis week I'll be creating a network of murders in the movie the Godfather.```{r data}# read in datamurders <-read_csv("Godfather_murders.csv", show_col_types =FALSE)# create to, from objectsfrom <- murders[, 1]to <- murders[, 2]# create network object - igraphmurders.ig <-graph_from_data_frame(murders, directed =TRUE)print(murders.ig)# create network object - tidygraphmurders_tidy <-as_tbl_graph(murders.ig)print(murders_tidy)```I've created a network object with both `igraph` and `tidygraph`, just to compare the two.The network is:* directed (one person commits the murder, the other is murdered)* named* unweighted* not bipartiteIt has 30 nodes and 21 edges. The network is not connected.```{r}# get number of componentsigraph::components(murders.ig)$no# get size of each componentigraph::components(murders.ig)$csize``````{r plot network}# create plotggraph(murders_tidy, layout ="auto") +geom_node_point() +geom_edge_diagonal() +labs(title ="Murders in the Godfather, Part 1") +theme_graph(foreground ="#c6a25a")```## Exploring degree```{r degree}# create df of degreesmurders_nodes <-data.frame(name =V(murders.ig)$name, degree = igraph::degree(murders.ig)) %>%mutate(indegree = igraph::degree(murders.ig, mode ="in", loops =FALSE),outdegree = igraph::degree(murders.ig, mode ="out", loops =FALSE))murders_nodes```For this network, any node with an out-degree of anything other than zero has *committed* a murder while any node with an in-degree of anything other than zero was ultimately murdered. Logically we know that no node should have an in-degree of greater than zero, as one can only be murdered once.```{r}# get summarysummary(murders_nodes)```Given the logical constraints of this network, there isn't much to revealed by the summary statistics. In the out-degree column we can see:* The maximum number of murders committed by any one person is 4.* The mean number of murders committed by all nodes is .7. This is the mean of *all* nodes, however, not the mean of the nodes who actually murdered someone. If we look at the out-degree distribution below, we can see that most nodes did not murder anyone and are therefore dragging the mean number of murders down significantly.```{r plot distribution}# create plotggplot(murders_nodes, aes(x = outdegree)) +geom_histogram(binwidth =1, fill ="#c6a25a") +labs(title ="Distribution of Murders in the Godfather, Part 1", x =NULL) +theme_minimal()```## DensityNetwork density is the proportion of ties present in a network of all possible ties. A complete network has a network density of "1." [I THINK] that in this particular network a density of "1" would mean that every node both murdered someone and was ultimately murdered._Possible ties = n(n-1)__Actual ties = (2 * # of mutual ties) + # of asymmetric ties_There are 870 possible ties and 21 actual ties.```{r density}# calc density manually - FOR PRACTICEn <-30p_ties <- n * (n-1)p_tiesmut <-dyad.census(murders.ig)$mutasym <-dyad.census(murders.ig)$asyma_ties <- (2* mut) + asyma_tiesa_ties/p_ties# get densitygraph.density(murders.ig)```## Random network```{r random network}# create random networkrandom <-erdos.renyi.game(30, 21, type ="gnm", directed =TRUE)# plot random networkggraph(random, layout ="auto") +geom_node_point() +geom_edge_diagonal() +labs(title ="Plot of Random Network") +theme_graph(foreground ="#c6a25a")```The random network is very different from the actual network.