Code
knitr::opts_chunk$set(echo = TRUE)knitr::opts_chunk$set(echo = TRUE)read in a dataset
create a network object
got_marriages <- read_csv("/Users/Bud/Desktop/DACSS_697E_Social Network Analysis_SP2023/Social_Networks_SP_2023/posts/_data/got/got_marriages.csv",show_col_types = FALSE)


View(got_marriages)#first five rows of marriages data
head(got_marriages)# A tibble: 6 x 5
From To Type Notes Generation
<chr> <chr> <chr> <chr> <chr>
1 Targaryen Stark Married R+L=J Current
2 Baratheon Martell Engaged died Current
3 Baratheon Stark Engaged broken Current
4 Martell Essos Married <NA> Current
5 Martell Reach Affair <NA> Current
6 Martell Essos Affair <NA> Current #last five rows of marriages data
tail(got_marriages)# A tibble: 6 x 5
From To Type Notes Generation
<chr> <chr> <chr> <chr> <chr>
1 Targaryen Crownlands Married <NA> Past
2 Crownlands Stormlands Affair <NA> Past
3 Targaryen Crownlands Married <NA> Past
4 Targaryen Crownlands Married <NA> Past
5 Targaryen Targaryen Married <NA> Past
6 Targaryen Targaryen Married <NA> Past #summary statistics of data
summary(got_marriages) From To Type Notes
Length:255 Length:255 Length:255 Length:255
Class :character Class :character Class :character Class :character
Mode :character Mode :character Mode :character Mode :character
Generation
Length:255
Class :character
Mode :character Load the package igraph and create an igraph object (i.e. a graph or network) in the form of an edge list. The command may vary whether the data is given as a list of connections or an adjacency matrix.
1)Is the network directed or undirected; 2)weighted or unweighted; 3)unimodal or bipartite; 4)Can you plot it?
# object from the data frame
marriages.ig<- graph_from_data_frame(got_marriages)print(marriages.ig)IGRAPH 246ae58 DN-- 20 255 --
+ attr: name (v/c), Type (e/c), Notes (e/c), Generation (e/c)
+ edges from 246ae58 (vertex names):
[1] Targaryen->Stark Baratheon->Martell Baratheon->Stark
[4] Martell ->Essos Martell ->Reach Martell ->Essos
[7] Martell ->Essos Martell ->Septa Martell ->Dorne
[10] Martell ->Targaryen Targaryen->Essos Targaryen->Essos
[13] Baratheon->Lannister Baratheon->Vale Baratheon->Riverlands
[16] Baratheon->Crownlands Baratheon->Reach Baratheon->Westerlands
[19] Baratheon->Crownlands Lannister->Lannister Baratheon->Reach
[22] Baratheon->Tyrell Tyrell ->Reach Tyrell ->Reach
+ ... omitted several edgesis_directed<-is_directed(marriages.ig)
if (is_directed) {
print("The network is directed.")
} else {
print("The network is not directed.")
}[1] "The network is directed."is_weighted<-is_weighted(marriages.ig)
if (is_weighted) {
print("The network is weighted.")
} else {
print("The network is not weighted.")
}[1] "The network is not weighted."is_bipartite <- is_bipartite(marriages.ig)
if (is_bipartite) {
print("The network is bipartite.")
} else {
print("The network is not bipartite.")
}[1] "The network is not bipartite."# vertex and edge attributes
V(marriages.ig)$label <- V(marriages.ig)$name
E(marriages.ig)$arrow.size <- 0
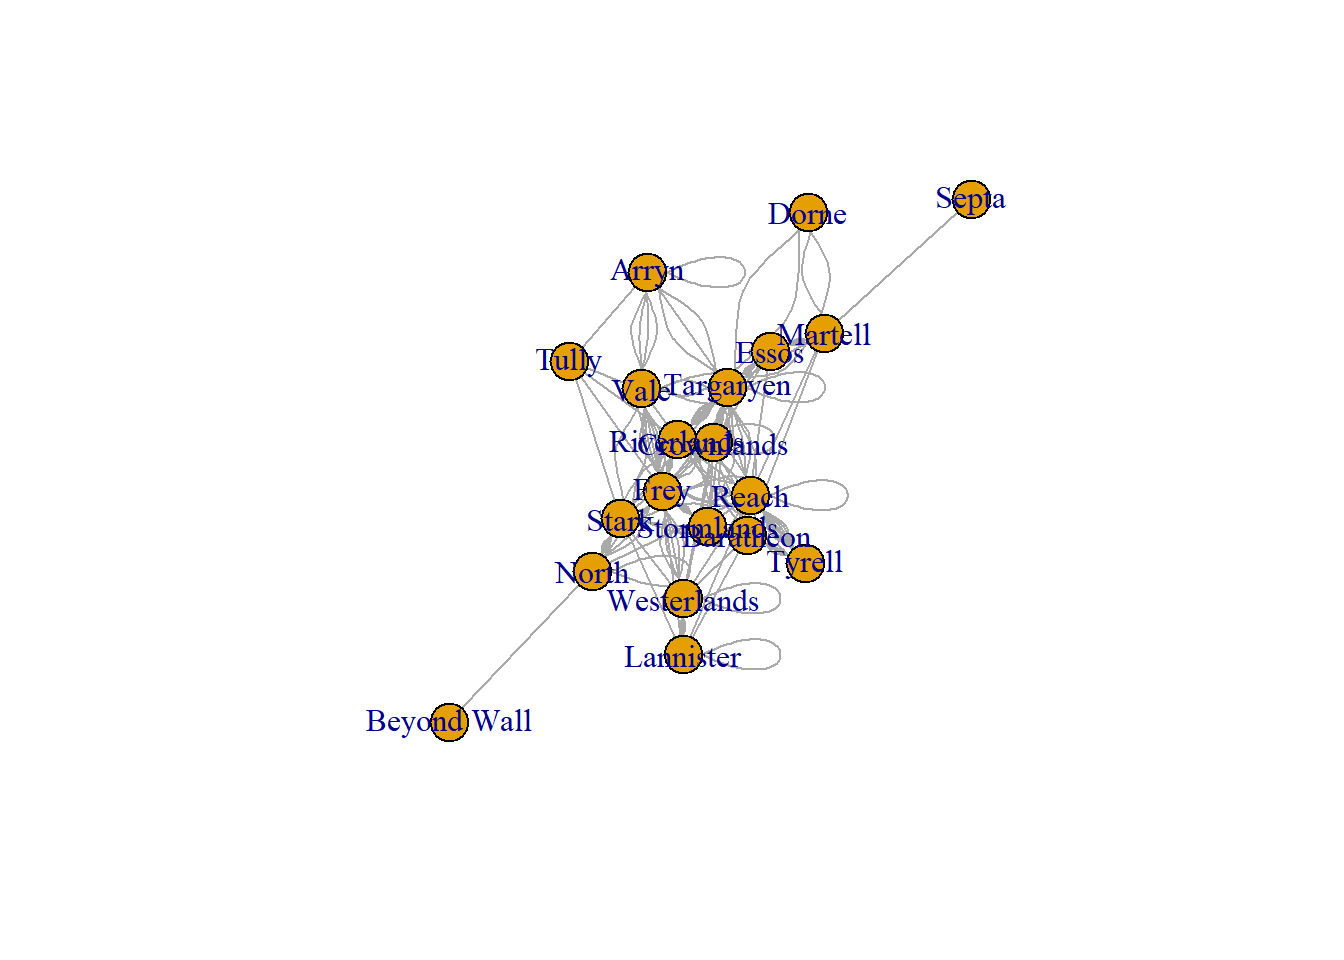
# graph layout and plot
layout <- layout_with_fr(marriages.ig)
plot(marriages.ig, layout=layout)