Read in one (or more) of the following data sets, using the correct R package and command.
got_like_dislike.csv
Find the _data folder, located inside the posts folder. Then you can read in the data, using base read.csv or read_csv standard tidy read command to read Comma Separated Values files or, alternatively, read the data in directly from loading a package.
Rows: 46 Columns: 49
── Column specification ────────────────────────────────────────────────────────
Delimiter: ","
chr  (3): Current house, Former house, Name
dbl (46): Lysa Arryn, Petyr Baelish, Joffrey Baratheon, Margaery Tyrell, Ren...

ℹ Use `spec()` to retrieve the full column specification for this data.
ℹ Specify the column types or set `show_col_types = FALSE` to quiet this message.
The dataset has 46 rows and 49 columns
Create a Network
Load the package igraph and create an igraph object (i.e. a graph or network) in the form of an edge list. The command may vary whether the data is given as a list of connections or an adjacency matrix. Is the network directed or undirected; weighted or unweighted; unimodal or bipartite? Can you plot it?
Code
library(igraph)
Attaching package: 'igraph'
The following objects are masked from 'package:dplyr':

    as_data_frame, groups, union
The following objects are masked from 'package:purrr':

    compose, simplify
The following object is masked from 'package:tidyr':

    crossing
The following object is masked from 'package:tibble':

    as_data_frame
The following objects are masked from 'package:stats':

    decompose, spectrum
The following object is masked from 'package:base':

    union
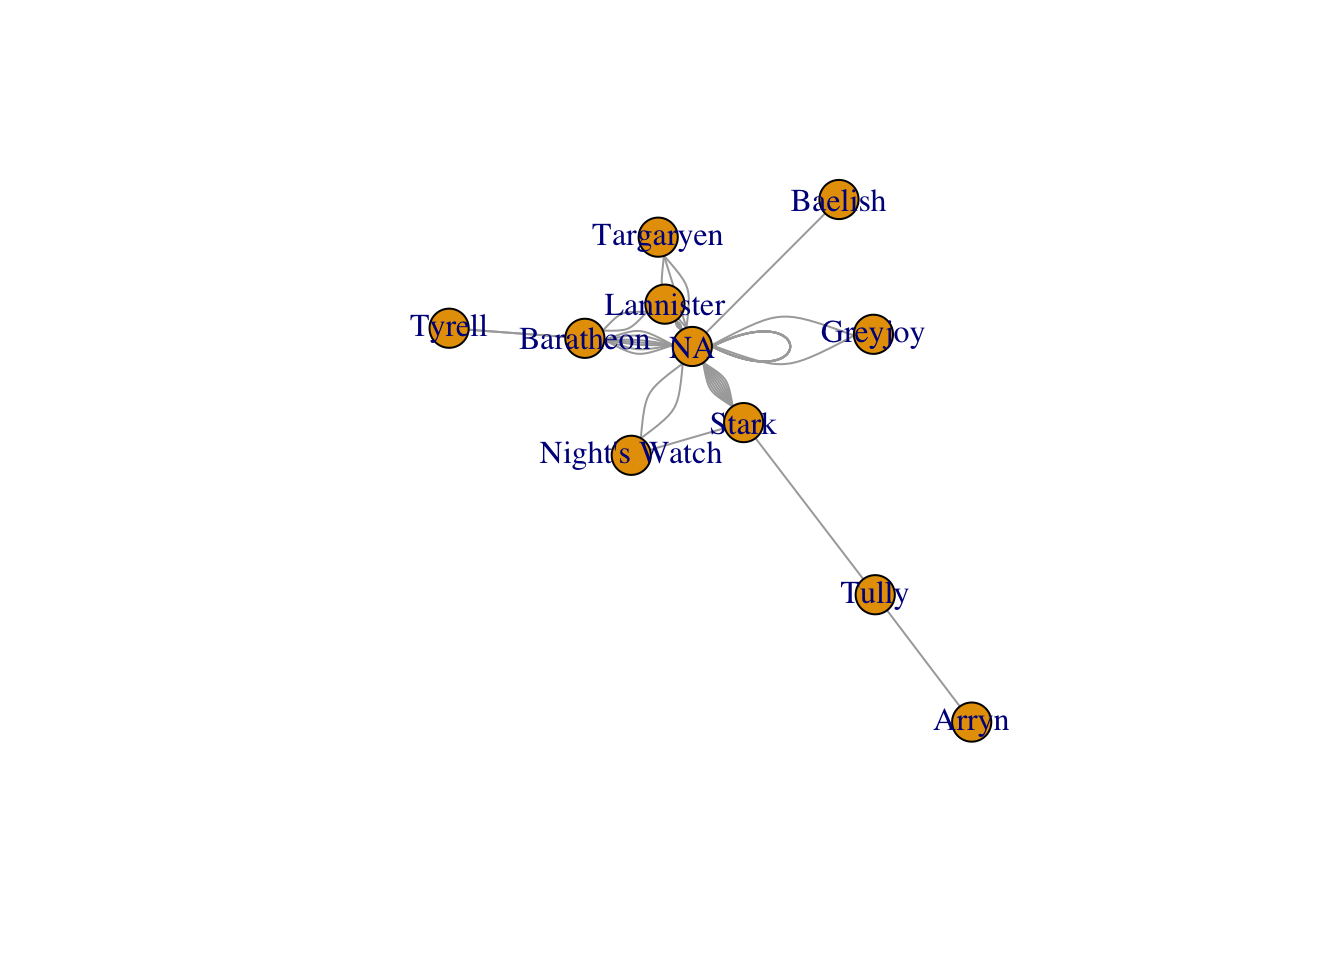
From the below commands we know that the data is undirected, unmweighted and unimodal.
Warning in graph_from_data_frame(got_like_dislike, directed = FALSE): In `d'
`NA' elements were replaced with string "NA"
Code
is_directed(got_like_dislike.ig)
[1] FALSE
Code
is_weighted(got_like_dislike.ig)
[1] FALSE
Code
is_bipartite(got_like_dislike.ig)
[1] FALSE
Code
plot.igraph(got_like_dislike.ig)
Source Code
---title: "Week 1 Challenge"author: "Jyoti Rani"description: "Loading Data and Creating a Network"date: "02/22/2023"format: html: toc: true code-fold: true code-copy: true code-tools: true# editor: visualcategories: - challenge_1 - Loading data and creating network - Jyoti Rani---```{r}#| label: setup#| include: false```## Challenge OverviewToday's challenge is to1) read in a dataset, and2) create a network object```{r}library(tidyverse)```## Load the DataRead in one (or more) of the following data sets, using the correct R package and command.- got_like_dislike.csvFind the `_data` folder, located inside the `posts` folder. Then you can read in the data, using base `read.csv` or `read_csv` standard tidy read command to read Comma Separated Values files or, alternatively, read the data in directly from loading a package.```{r}got_like_dislike <-read_csv("_data/got/got_like_dislike.csv")```### The dataset has 46 rows and 49 columns## Create a NetworkLoad the package `igraph` and create an `igraph` object (i.e. a graph or network) in the form of an edge list. The command may vary whether the data is given as a list of connections or an adjacency matrix. Is the network directed or undirected; weighted or unweighted; unimodal or bipartite? Can you plot it?```{r}library(igraph)```### From the below commands we know that the data is undirected, unmweighted and unimodal.The plot is below:```{r}got_like_dislike.ig <-graph_from_data_frame(got_like_dislike, directed =FALSE)is_directed(got_like_dislike.ig)is_weighted(got_like_dislike.ig)is_bipartite(got_like_dislike.ig)plot.igraph(got_like_dislike.ig)```