Read in one (or more) of the following data sets, using the correct R package and command.
got_marriages.csv
fish_encounters dataset (available in the tidyr package)
got_like_dislike.csv
Find the _data folder, located inside the posts folder. Then you can read in the data, using base read.csv or read_csv standard tidy read command to read Comma Separated Values files or, alternatively, read the data in directly from loading a package.
Code
# Read in tidyverse and igraph packages for got marriages data framelibrary(tidyverse)
── Attaching core tidyverse packages ──────────────────────── tidyverse 2.0.0 ──
✔ dplyr     1.1.2     ✔ readr     2.1.4
✔ forcats   1.0.0     ✔ stringr   1.5.0
✔ ggplot2   3.4.2     ✔ tibble    3.2.1
✔ lubridate 1.9.2     ✔ tidyr     1.3.0
✔ purrr     1.0.1
── Conflicts ────────────────────────────────────────── tidyverse_conflicts() ──
✖ dplyr::filter() masks stats::filter()
✖ dplyr::lag()    masks stats::lag()
ℹ Use the conflicted package (<http://conflicted.r-lib.org/>) to force all conflicts to become errors
Code
library(igraph)
Attaching package: 'igraph'

The following objects are masked from 'package:lubridate':

    %--%, union

The following objects are masked from 'package:dplyr':

    as_data_frame, groups, union

The following objects are masked from 'package:purrr':

    compose, simplify

The following object is masked from 'package:tidyr':

    crossing

The following object is masked from 'package:tibble':

    as_data_frame

The following objects are masked from 'package:stats':

    decompose, spectrum

The following object is masked from 'package:base':

    union
Code
# find got marriages data framegot_marriages <-read.csv("C:/Users/18639/Social_Networks_Spring_2023/posts/_data/got/got_marriages.csv")
Add any comments or documentation as needed. More challenging data sets may require additional code chunks and documentation.
Load the package igraph and create an igraph object (i.e. a graph or network) in the form of an edge list. The command may vary whether the data is given as a list of connections or an adjacency matrix. Is the network directed or undirected; weighted or unweighted; unimodal or bipartite? Can you plot it?
Code
# Count the vertex objects in a network function: igraphvcount(graph)
[1] 20
Code
# Count the edge objects in a network function: igraphecount(graph)
[1] 255
Code
# what type of network data is this object bipartite or weighted?

is_bipartite(graph)
[1] FALSE
Code
# are the network objects in this graph weighted or not?

is_weighted(graph)
[1] FALSE
Code
# are the network objects directed or undirected?is_directed(graph)
[1] TRUE
Code
# display vertex names for got marriages set for igraph objectvertex_attr_names(graph)
[1] "name"
Code
# display edge names for got marriages set for igraph objectedge_attr_names(graph)
character(0)
Code
# next step is to start describing the actual network itself we see this with the co-joining of the data frame and attributes# access vertex attribute in igraph for got marriages date frame: igraphV(graph)$name
# access edge attributes in igraph for got marriages data frame: igraph

E(graph)$weight
NULL
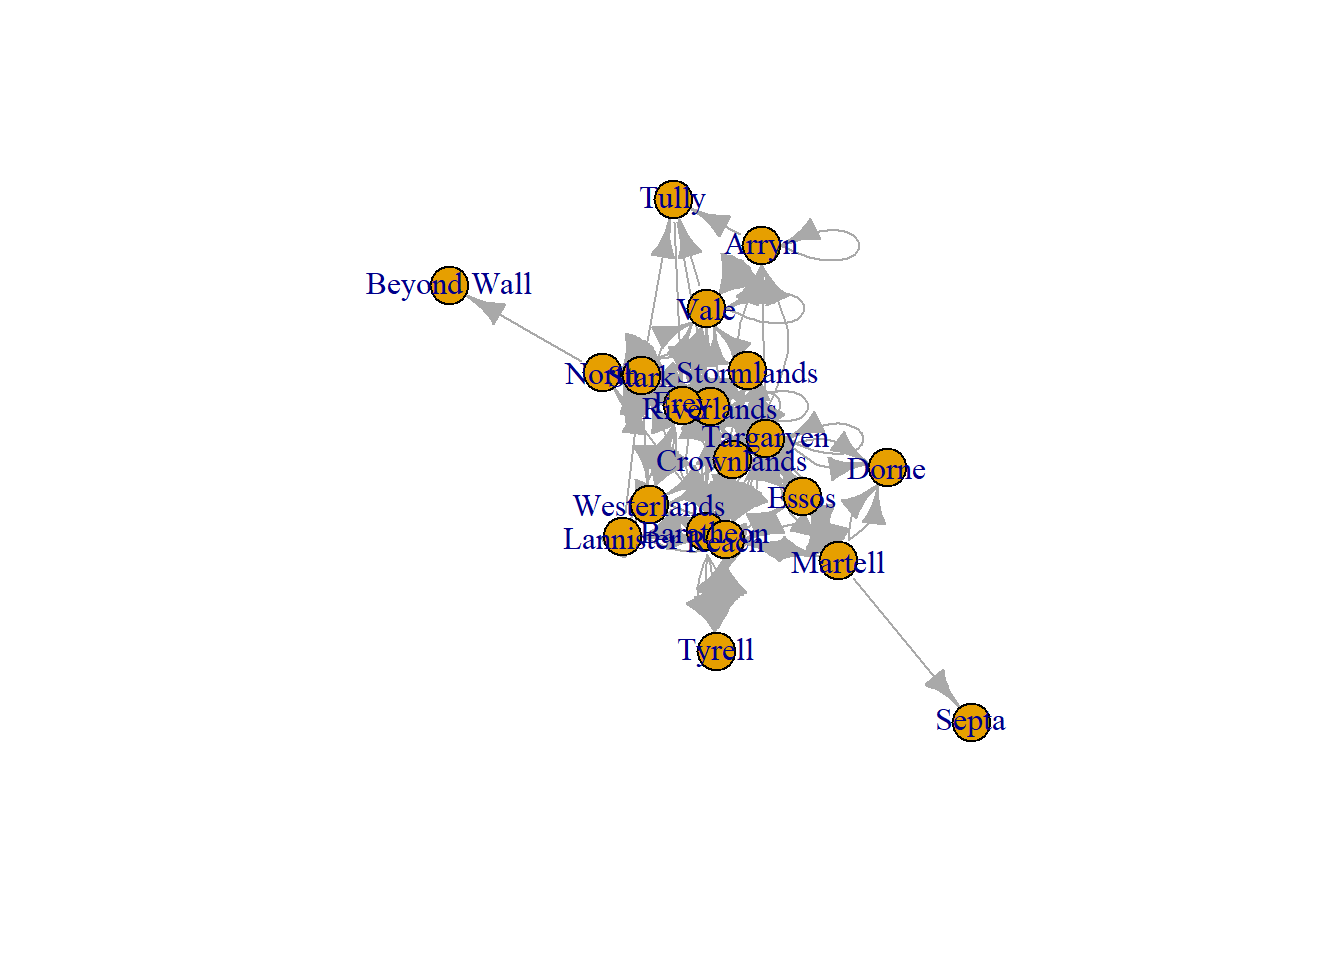
Code
plot(graph)
Source Code
---title: "Week 1 Challenge Instructions"author: "Hannah Rosenbaum"description: "Loading Data and Creating a Network"date: "02/13/2023"format: html: toc: true code-fold: true code-copy: true code-tools: true# editor: visualcategories: - challenge_1 - instructions # - railroads # - faostat # - wildbirds---```{r}#| label: setup#| include: false#| ```## Challenge OverviewToday's challenge is to1) read in a dataset, and2) create a network object## Load the DataRead in one (or more) of the following data sets, using the correct R package and command.- got_marriages.csv- fish_encounters dataset (available in the `tidyr` package)- got_like_dislike.csvFind the `_data` folder, located inside the `posts` folder. Then you can read in the data, using base `read.csv` or `read_csv` standard tidy read command to read Comma Separated Values files or, alternatively, read the data in directly from loading a package.```{r}# Read in tidyverse and igraph packages for got marriages data framelibrary(tidyverse)library(igraph)``````{r}# find got marriages data framegot_marriages <-read.csv("C:/Users/18639/Social_Networks_Spring_2023/posts/_data/got/got_marriages.csv")```Add any comments or documentation as needed. More challenging data sets may require additional code chunks and documentation.## Create a Network```{r}graph <-graph_from_edgelist(as.matrix(got_marriages[, c("From", "To")]))```Load the package `igraph` and create an `igraph` object (i.e. a graph or network) in the form of an edge list. The command may vary whether the data is given as a list of connections or an adjacency matrix. Is the network directed or undirected; weighted or unweighted; unimodal or bipartite? Can you plot it?```{r}# Count the vertex objects in a network function: igraphvcount(graph)# Count the edge objects in a network function: igraphecount(graph)# what type of network data is this object bipartite or weighted? is_bipartite(graph)# are the network objects in this graph weighted or not? is_weighted(graph)# are the network objects directed or undirected?is_directed(graph)# display vertex names for got marriages set for igraph objectvertex_attr_names(graph)# display edge names for got marriages set for igraph objectedge_attr_names(graph)# next step is to start describing the actual network itself we see this with the co-joining of the data frame and attributes# access vertex attribute in igraph for got marriages date frame: igraphV(graph)$name# access edge attributes in igraph for got marriages data frame: igraph E(graph)$weightplot(graph)```