Read in one (or more) of the following data sets, using the correct R package and command.
got_marriages.csv
fish_encounters dataset (available in the tidyr package)
got_like_dislike.csv
Find the _data folder, located inside the posts folder. Then you can read in the data, using base read.csv or read_csv standard tidy read command to read Comma Separated Values files or, alternatively, read the data in directly from loading a package.
Rows: 255 Columns: 5
── Column specification ────────────────────────────────────────────────────────
Delimiter: ","
chr (5): From, To, Type, Notes, Generation

ℹ Use `spec()` to retrieve the full column specification for this data.
ℹ Specify the column types or set `show_col_types = FALSE` to quiet this message.
Add any comments or documentation as needed. More challenging data sets may require additional code chunks and documentation.
Create a Network
Load the package igraph and create an igraph object (i.e. a graph or network) in the form of an edge list. The command may vary whether the data is given as a list of connections or an adjacency matrix. Is the network directed or undirected; weighted or unweighted; unimodal or bipartite? Can you plot it?
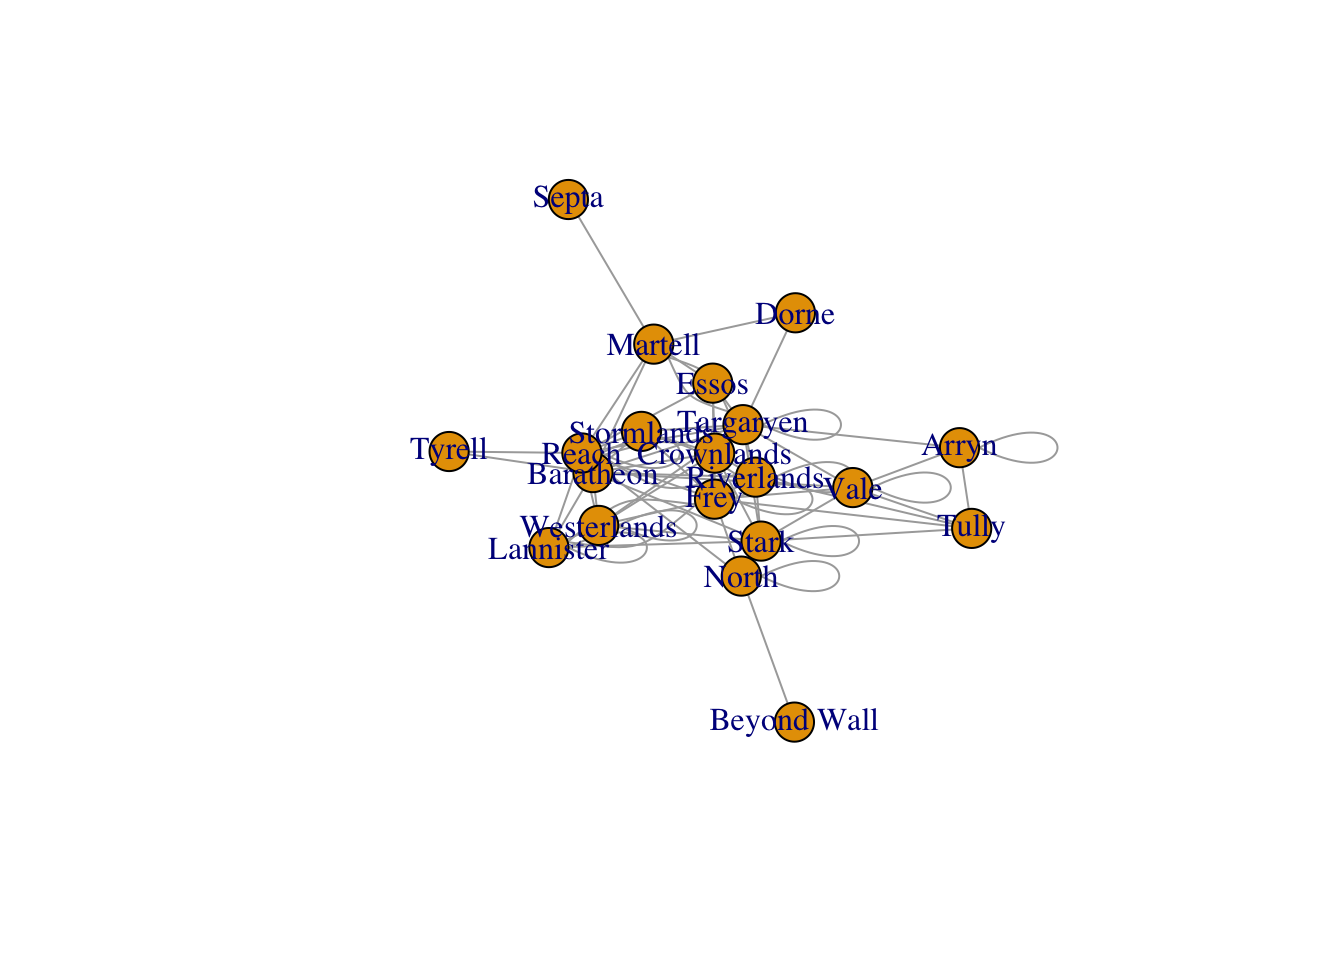
The first graph I create is by attempting to add weights to the edges based on what we discussed in class. I am still looking for resources on statnet graphing.
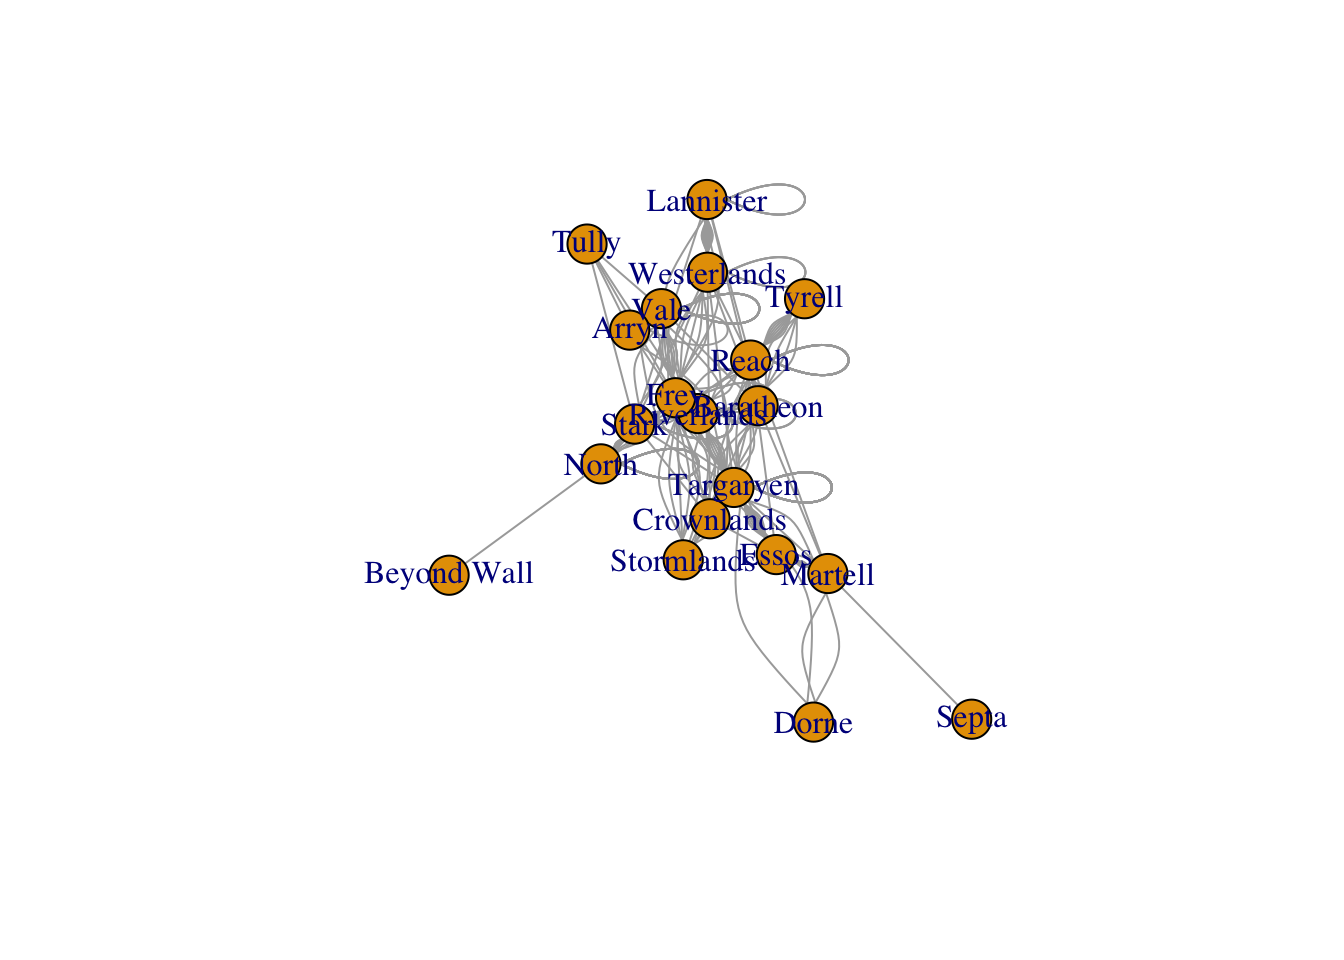
The graph is an undirected graph because when we look at marriage networks, when one is married to the other person, that other person is also married. It’s a mutual relationship. Groups of certain families have a history of marrying one another according to this network. There are even internal marriages that take place within certain families. The Tyrells only marry to two houses. What families have the marriages with the most families? Which families tend to marry the most within themselves?
The Targaryens have the most marriages in other families. Since degree represents the total edges connected to the particular nodes, I can see that with 85 total degrees, the Targaryen family has the most marriages to other houses.
Code
vcount(got_graph)
[1] 20
Code
ecount(got_graph)
[1] 255
Code
degree(got_graph)
Error in FUN(X[[i]], ...): as.edgelist.sna input must be an adjacency matrix/array, edgelist matrix, network, or sparse matrix, or list thereof.
Code
is_weighted(got_graph)
[1] FALSE
Code
is_bipartite(got_graph)
[1] FALSE
The network is both not weighted and not bipartite.
Source Code
---title: "Week 1 Challenge"author: "Quinn He"description: "Loading Data and Creating a Network"date: "02/13/2023"format: html: toc: true code-fold: true code-copy: true code-tools: true# editor: visualcategories: - challenge_1 - instruction # - railroads # - faostat # - wildbirds---```{r}#| label: setup#| include: falselibrary(tidyverse)library(igraph)library(statnet)```## Challenge OverviewToday's challenge is to1) read in a dataset, and2) create a network object## Load the DataRead in one (or more) of the following data sets, using the correct R package and command.- got_marriages.csv- fish_encounters dataset (available in the `tidyr` package)- got_like_dislike.csvFind the `_data` folder, located inside the `posts` folder. Then you can read in the data, using base `read.csv` or `read_csv` standard tidy read command to read Comma Separated Values files or, alternatively, read the data in directly from loading a package.```{r}got <-read_csv("../posts/_data/got/got_marriages.csv")```Add any comments or documentation as needed. More challenging data sets may require additional code chunks and documentation.## Create a NetworkLoad the package `igraph` and create an `igraph` object (i.e. a graph or network) in the form of an edge list. The command may vary whether the data is given as a list of connections or an adjacency matrix. Is the network directed or undirected; weighted or unweighted; unimodal or bipartite? Can you plot it?The first graph I create is by attempting to add weights to the edges based on what we discussed in class. I am still looking for resources on statnet graphing. ```{r}got2<-group_by(got, From, To) %>%summarise(weight =n())``````{r}got2_graph <-graph_from_data_frame(got2, directed = F)plot(got2_graph)```The next graph is using basic, unweighted functions.```{r}#| label: summary#deg <- degree(got, mode="all")#V(got)$size <-deg*3got_graph <-graph_from_data_frame(got, directed = F)plot(got_graph)```The graph is an undirected graph because when we look at marriage networks, when one is married to the other person, that other person is also married. It's a mutual relationship. Groups of certain families have a history of marrying one another according to this network. There are even internal marriages that take place within certain families. The Tyrells only marry to two houses. What families have the marriages with the most families? Which families tend to marry the most within themselves?The Targaryens have the most marriages in other families. Since degree represents the total edges connected to the particular nodes, I can see that with 85 total degrees, the Targaryen family has the most marriages to other houses. ```{r}vcount(got_graph)``````{r}ecount(got_graph)``````{r}degree(got_graph)``````{r}is_weighted(got_graph)``````{r}is_bipartite(got_graph)```The network is both not weighted and not bipartite.