Code
data = read.csv('_data\\got\\got_like_dislike.csv', header=TRUE)
data = data[,4:ncol(data)]
# Convert the data frame to matrix
adj_matrix <- as.matrix(data)Today’s challenge is to
read in a dataset, and
create a network object
data = read.csv('_data\\got\\got_like_dislike.csv', header=TRUE)
data = data[,4:ncol(data)]
# Convert the data frame to matrix
adj_matrix <- as.matrix(data)igraph and create an igraph object,library(igraph)
# create a graph object from the adjacency matrix
graph.ig <- graph_from_adjacency_matrix(adj_matrix, mode = "undirected", diag = FALSE, weighted = TRUE)
# simplify the graph to remove multiple edges and combine their weights
graph.ig <- simplify(graph.ig, edge.attr.comb = "sum")
# add a small positive value to all edge weights to avoid layout errors
E(graph.ig)$weight <- E(graph.ig)$weight + 10
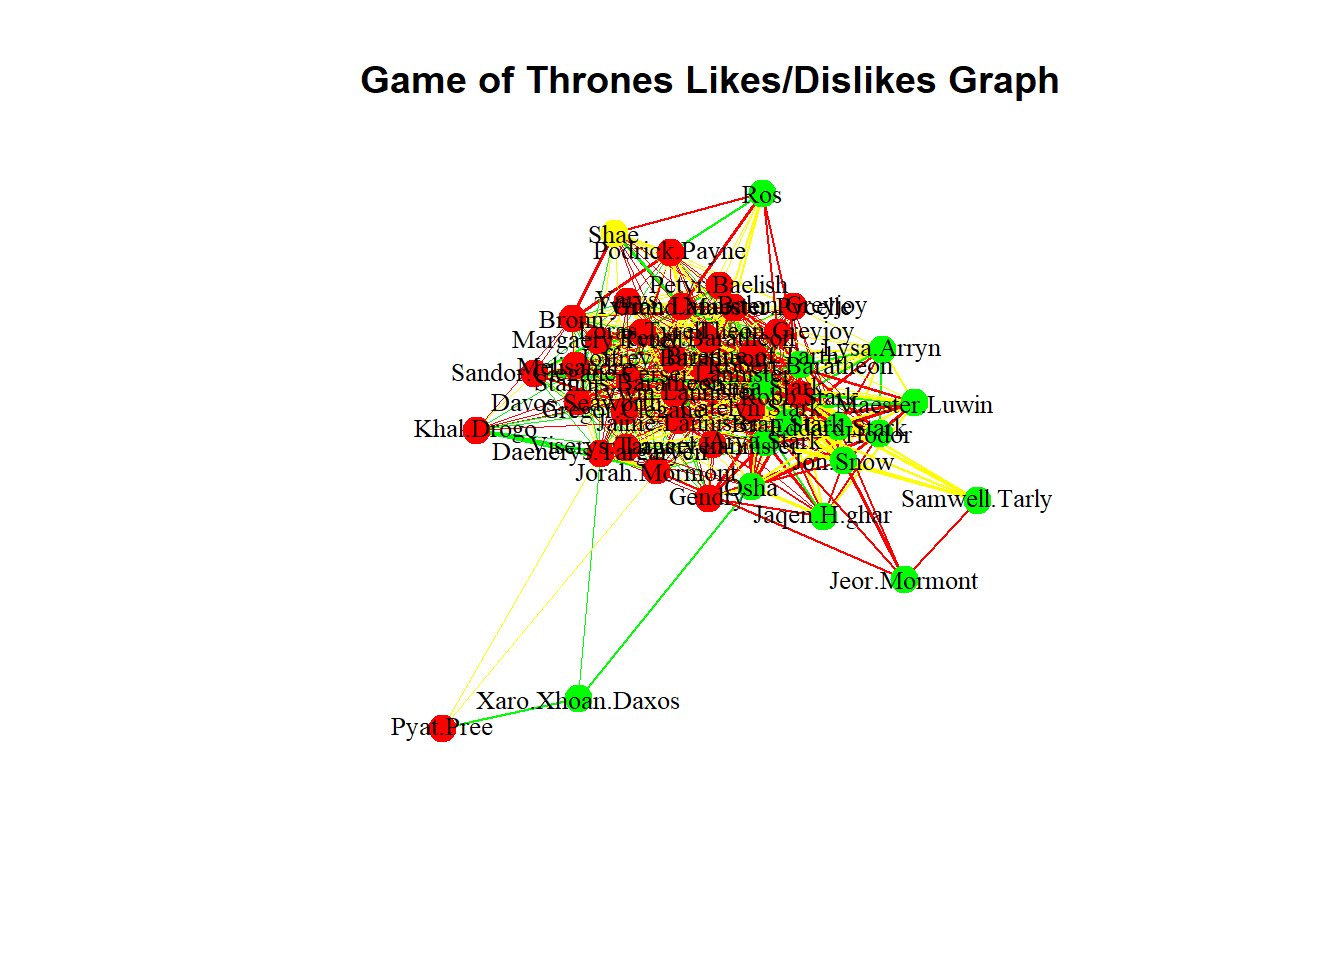
# specify color vectors based on likes/dislikes column for vertices and edges
color_vector <- ifelse(rowSums(adj_matrix, na.rm = TRUE) > 0, "green", ifelse(rowSums(adj_matrix, na.rm = TRUE) < 0, "red", "yellow"))
edge_color_vector <- ifelse(adj_matrix > 0, "green", ifelse(adj_matrix < 0, "red", "yellow"))
# plot the graph with adjusted parameters
plot(graph.ig,
layout=layout_with_fr(graph.ig, weights = E(graph.ig)$weight),
vertex.size=10,
vertex.label.cex=0.8,
vertex.label.color= 'black',
vertex.frame.color = color_vector,
vertex.color = color_vector,
edge.arrow.size=0.5,
edge.width=E(graph.ig)$weight/10,
edge.color=edge_color_vector,
main="Game of Thrones Likes/Dislikes Graph")