got_marriages <- read_csv("_data/got/got_marriages.csv", show_col_types = FALSE)Short Assignment 1: Reading Network Data
Reading in data
IGraph from Edgelist
This edgelist comes with edge attributes Type, Notes and Generation.
#Directed = FALSE because marriages are intrinsically symmetric:
got_marriages.net <- graph_from_data_frame(got_marriages,
                                           directed = FALSE)
got_marriages.net
IGRAPH 98de1a9 UN-- 20 255 --
+ attr: name (v/c), Type (e/c), Notes (e/c), Generation (e/c)
+ edges from 98de1a9 (vertex names):
[1] Targaryen--Stark Baratheon--Martell Baratheon--Stark
[4] Martell --Essos Martell --Reach Martell --Essos
[7] Martell --Essos Martell --Septa Martell --Dorne
[10] Targaryen--Martell Targaryen--Essos Targaryen--Essos
[13] Baratheon--Lannister Baratheon--Vale Baratheon--Riverlands
[16] Baratheon--Crownlands Baratheon--Reach Baratheon--Westerlands
[19] Baratheon--Crownlands Lannister--Lannister Baratheon--Reach
[22] Baratheon--Tyrell Tyrell --Reach Tyrell --Reach
+ ... omitted several edgesThese are the vertexes (e.g. nodes). They represent a blend of land areas, administrative zones, and family Houses:
V(got_marriages.net)+ 20/20 vertices, named, from 98de1a9:
[1] Targaryen Baratheon Martell Lannister Tyrell Reach
[7] North Riverlands Westerlands Stark Vale Arryn
[13] Tully Frey Crownlands Stormlands Essos Septa
[19] Dorne Beyond WallAnd these are the types of edges we have:
unique(E(got_marriages.net)$Type)[1] "Married" "Engaged" "Affair" Plot
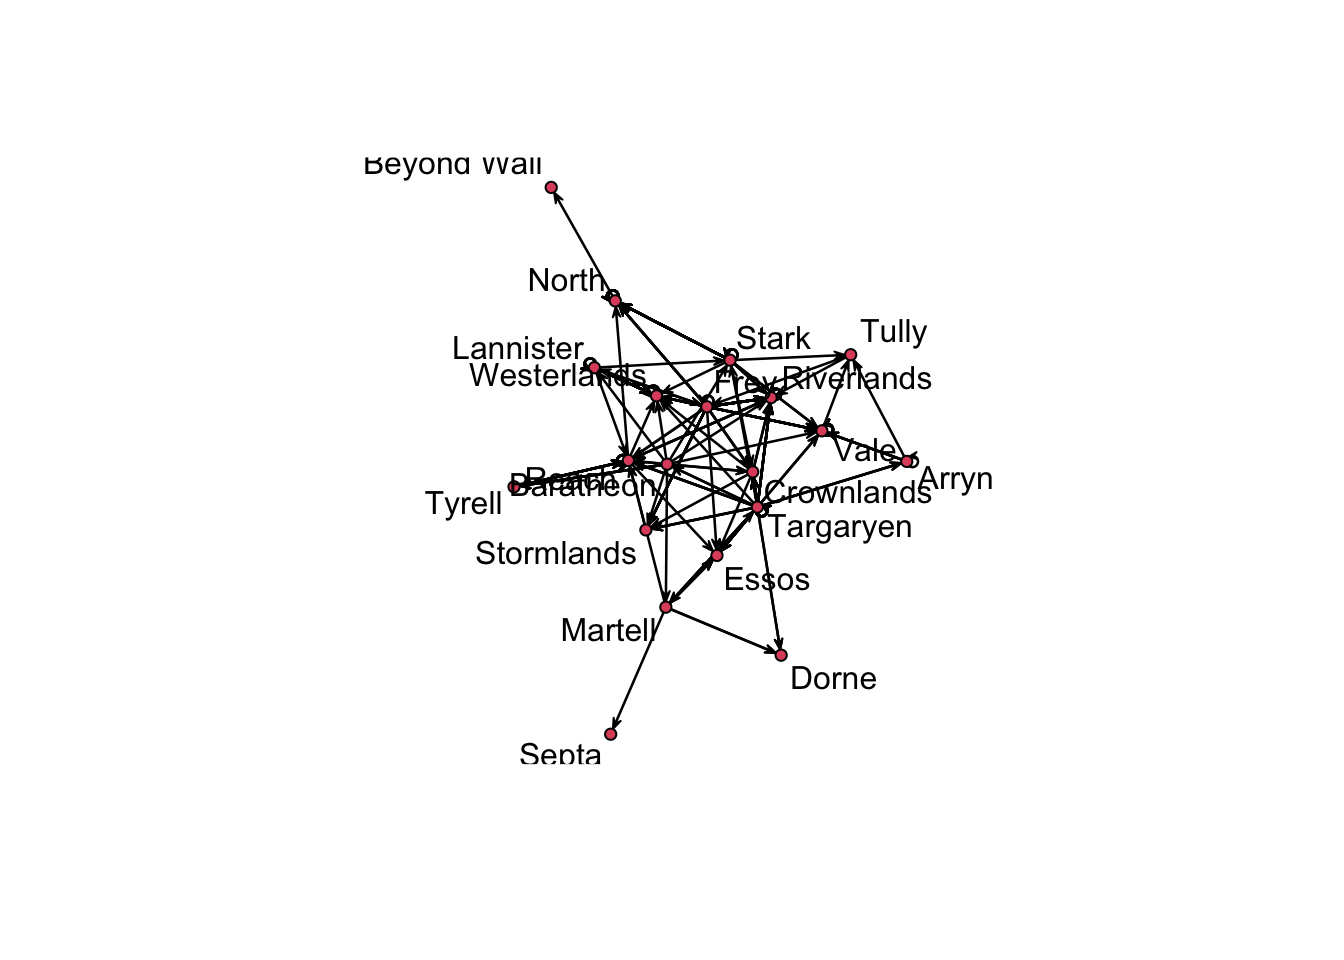
Here is the most basic plot, before assigning $Type to $weight
plot(got_marriages.net,
            arrow.mode="-")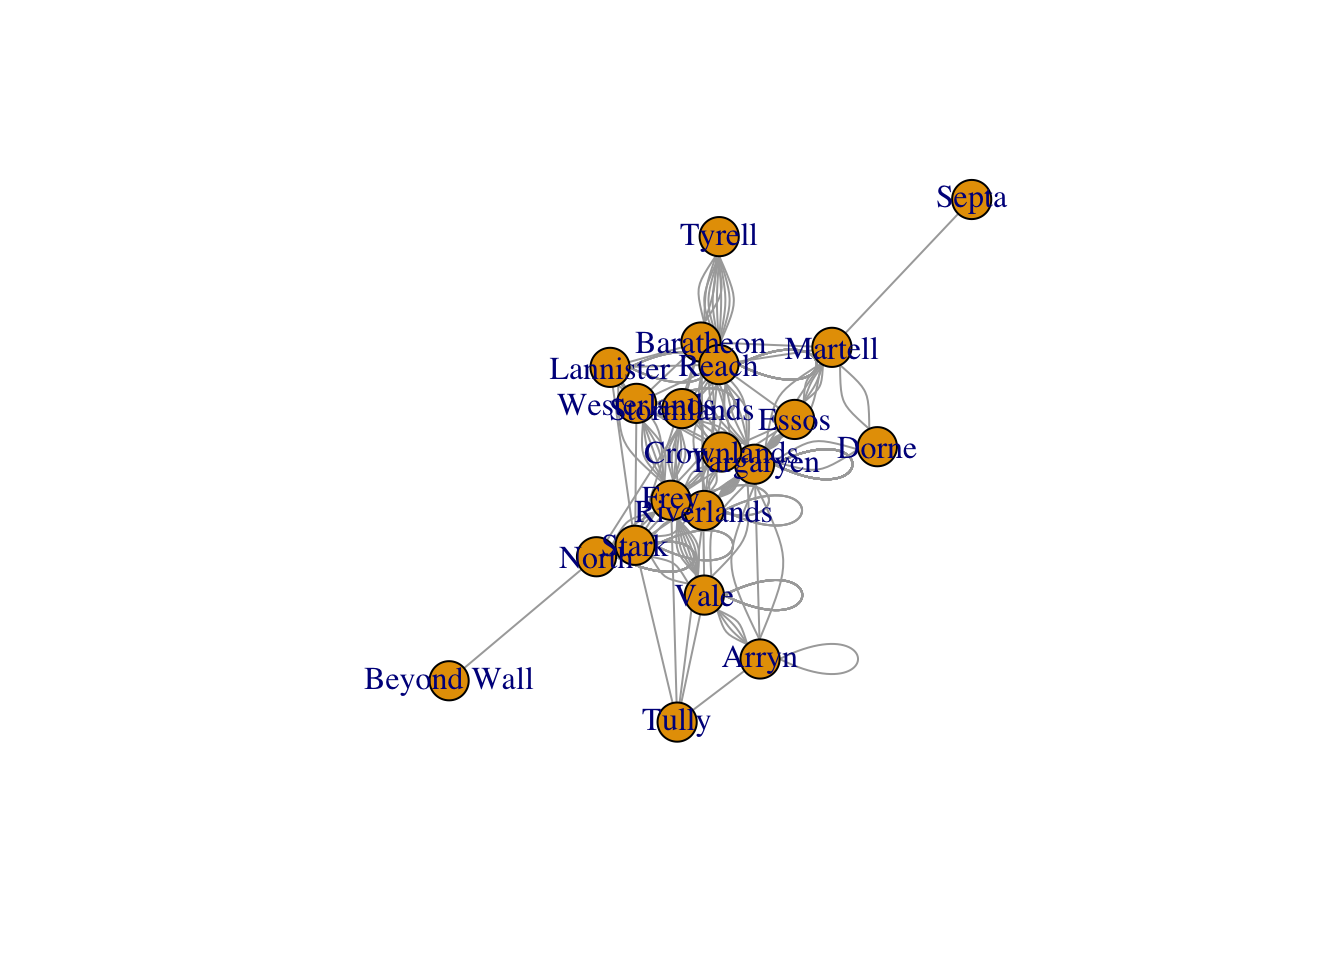
Here we add each marriage relationship, including affairs, to the weight value which has meaning to the igraph package
E(got_marriages.net)$weight<-E(got_marriages.net)$TypeAfter weight has been added, the graph looks much different:
plot(got_marriages.net,
            arrow.mode="-")
Warning in (function (graph, coords = NULL, dim = 2, niter = 500, start.temp =
sqrt(vcount(graph)), : NAs introduced by coercion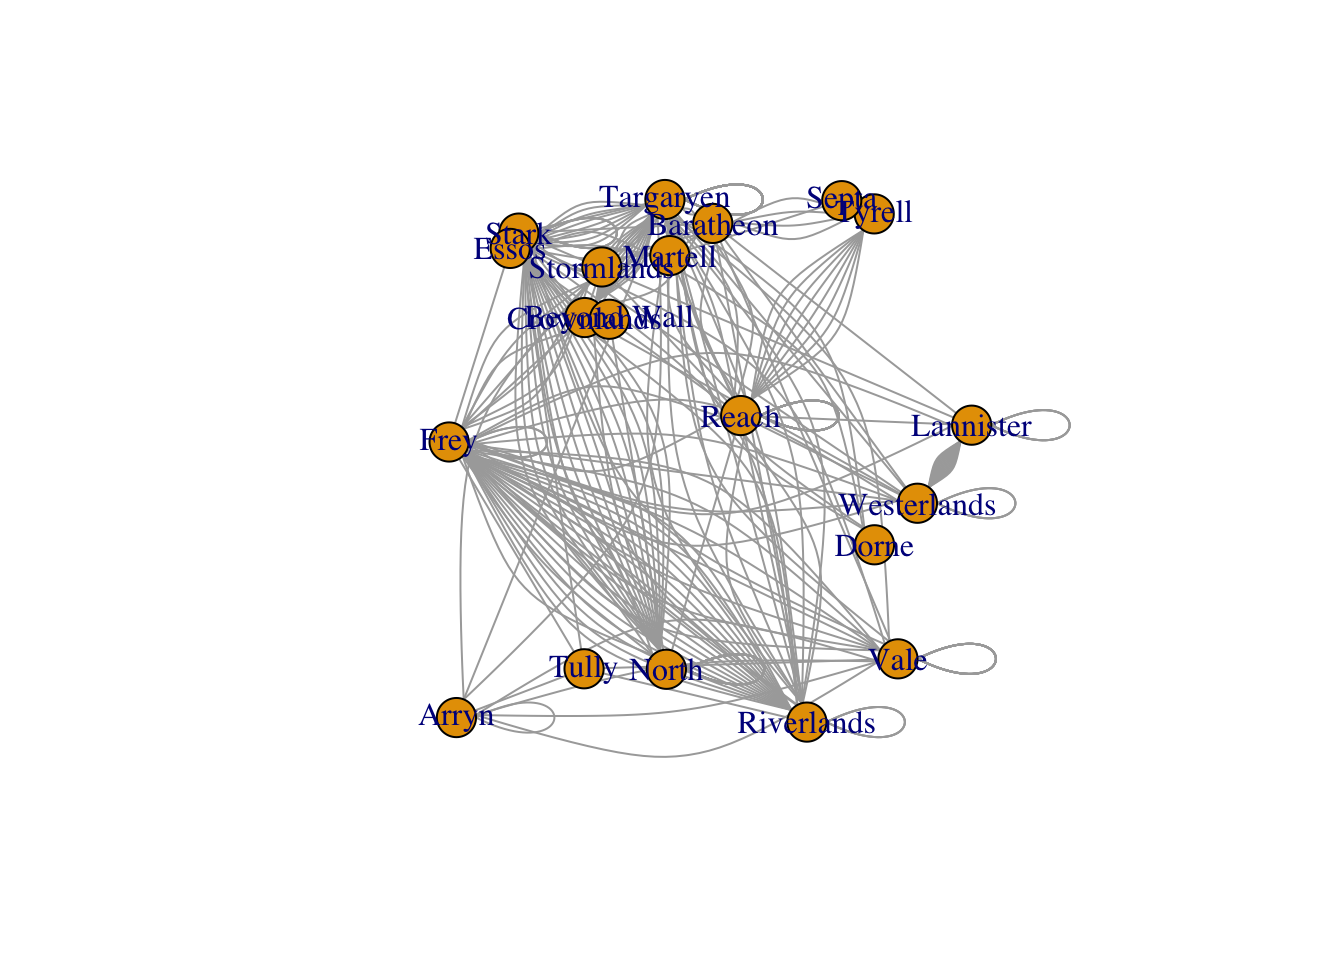
I want to color the edges according to specific marriage types:
#Define colors for each type of marriage
colors <- c(Married = "red",
            Engaged = "green",
            Affair = "blue")

#Match() matches "Married" with "red", and so on
E(got_marriages.net)$color <- colors[match(E(got_marriages.net)$Type, names(colors))]

plot(got_marriages.net,
     arrow.mode="-",
     edge.color=E(got_marriages.net)$color,
     vertex.label.family="Helvetica",
     main="Game of Thrones Marriage Network"
    )
Warning in (function (graph, coords = NULL, dim = 2, niter = 500, start.temp =
sqrt(vcount(graph)), : NAs introduced by coercionlegend("bottomleft", legend=c("Married", "Engaged", "Affair"), fill=colors, title="Type of marriage", cex=0.8)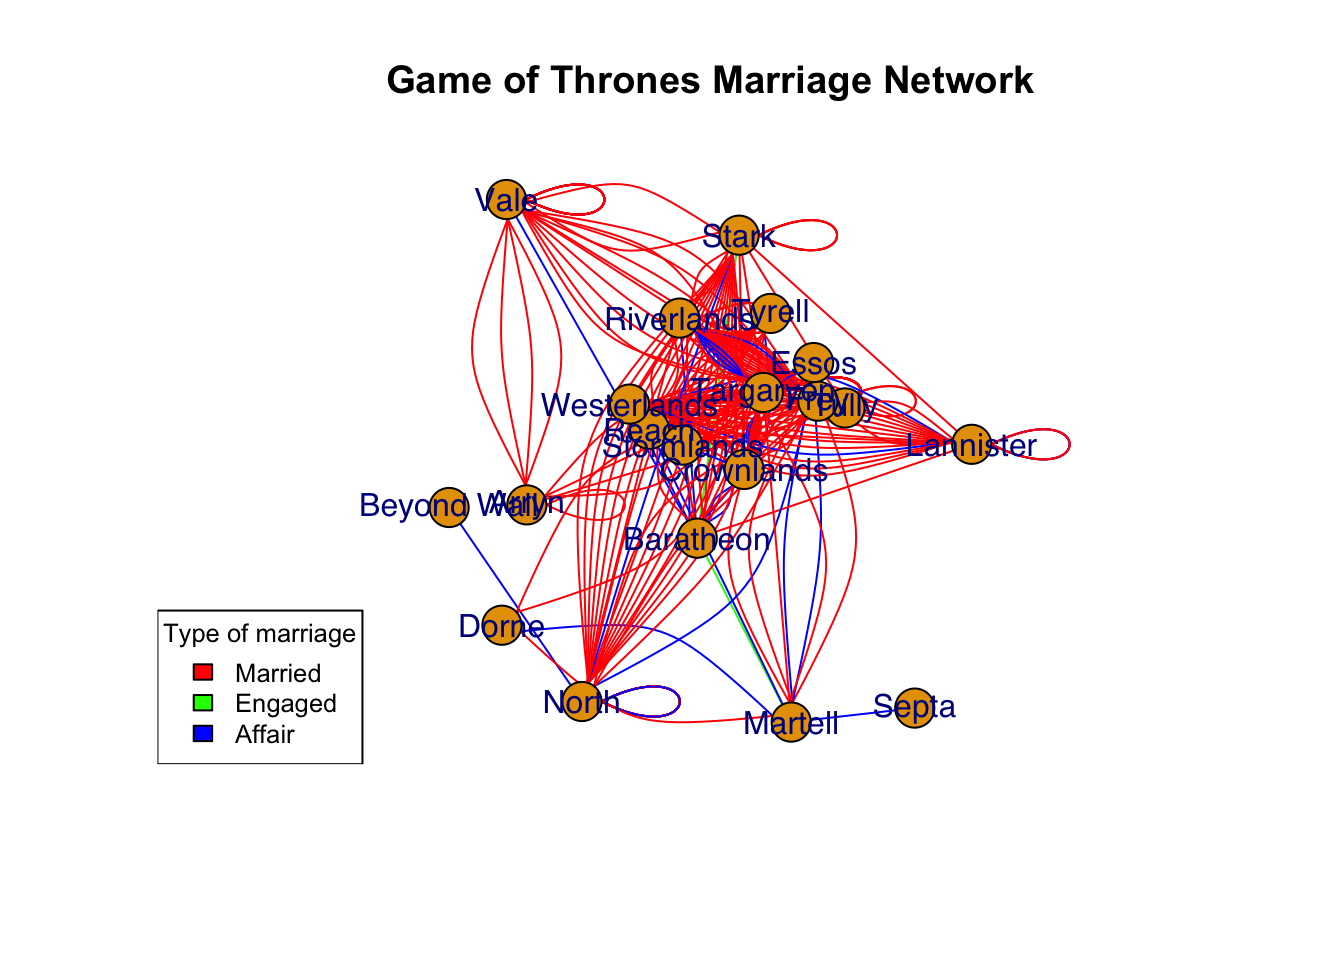
Here is an alternative, circular layout that in my opinion is not as useful because it does not highlight the social isolation of Beyond Wall:
layout1 <- layout_in_circle(got_marriages.net)

plot(got_marriages.net,
     arrow.mode="-",
     vertex.label.family="Helvetica",
     vertex.label.cex=.5,
     edge.color=E(got_marriages.net)$color,
     edge.width=1,
     main="Game of Thrones Marriage Network",
     layout = layout1
     )
legend("bottomleft", legend=c("Married", "Engaged", "Affair"), fill=colors, title="Type of marriage", cex=0.8)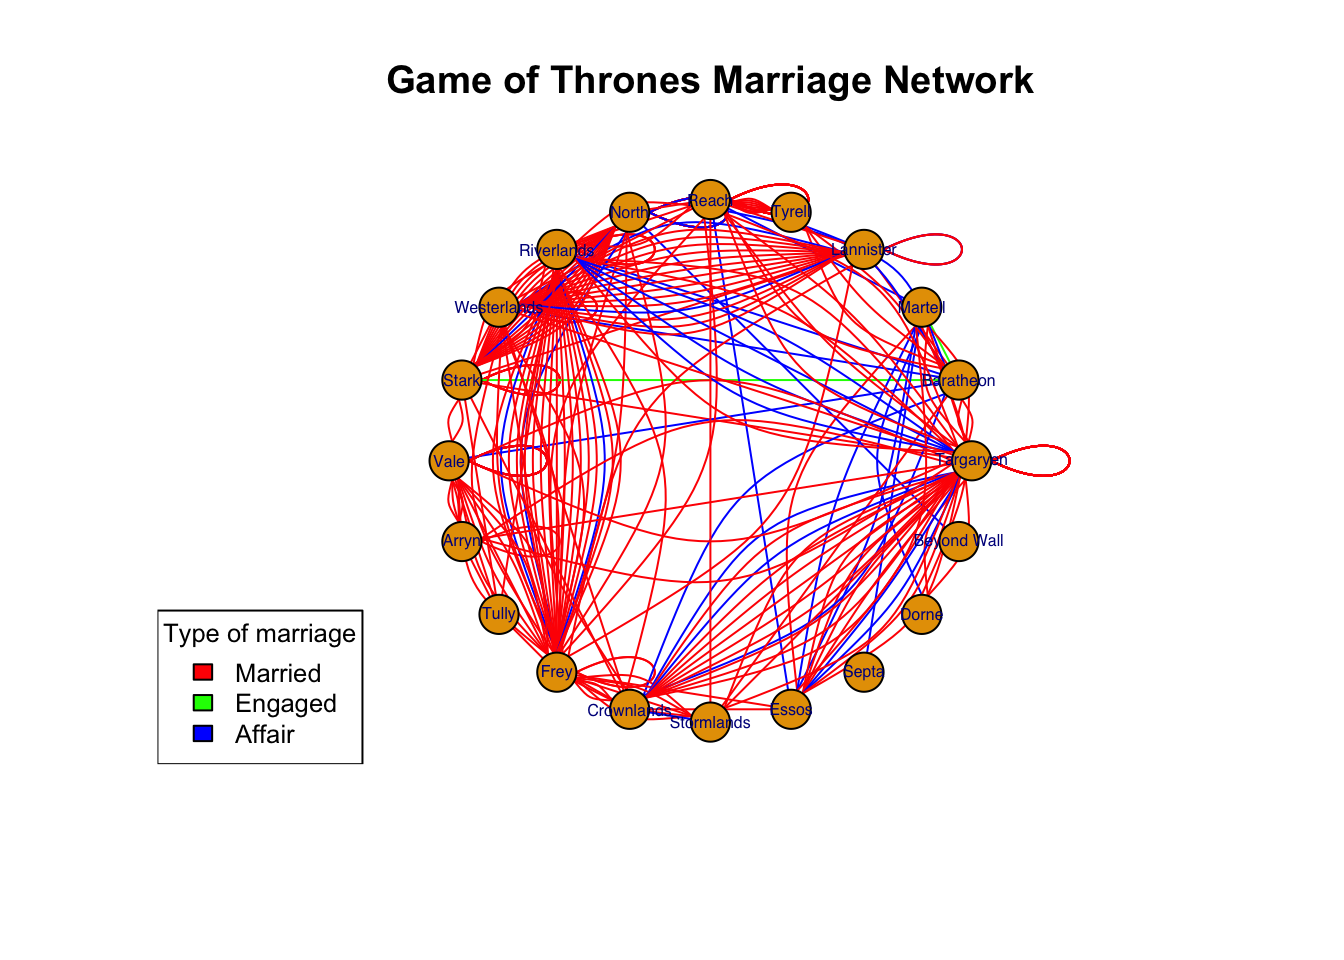
Statnet
I am assuming “loops” are cases where Lannister – Lannister, or similar. So I’ll be setting that to TRUE. And multiple to TRUE as well.
got_marriages.stat <- as.network(got_marriages, loops = TRUE, multiple = TRUE)
print(got_marriages.stat)
Network attributes:
vertices = 20
directed = TRUE
hyper = FALSE
loops = TRUE
multiple = TRUE
bipartite = FALSE
total edges= 255
missing edges= 0
non-missing edges= 255
Vertex attribute names:
vertex.names
Edge attribute names:
Generation Notes Type This is a network object rather than a igraph object we were using before.
class(got_marriages.stat)[1] "network"class(got_marriages.net)[1] "igraph"Plotting is ugly, but functional:
plot(got_marriages.stat,
     displaylabels = T)