Code
library(readxl)
library(plyr)
library(tidyverse)
library(tidytext)
library(quanteda)
library(quanteda.textplots)

knitr::opts_chunk$set(echo = TRUE)library(readxl)
library(plyr)
library(tidyverse)
library(tidytext)
library(quanteda)
library(quanteda.textplots)
knitr::opts_chunk$set(echo = TRUE)# load tidy data from blog post 2
load("CFA_tidy.RData")I am most interested in the question “What changes would you like to see for Missoula’s food system?” so I’ll start there. First I’ll create a corpus of the responses.
# create corpus for "change"
change_corpus <- corpus(CFA_tidy$change)

# save
save(change_corpus, file = "change_corpus.RData")

# get summary
change_summary <- summary(change_corpus)

# add indicator (not sure I need this but it won't hurt)
change_summary$question <- "change"

# preview
head(change_summary)
Text Types Tokens Sentences question
1 text1 7 7 1 change
2 text2 10 10 1 change
3 text3 75 98 2 change
4 text4 38 40 2 change
5 text5 6 6 1 change
6 text6 12 12 1 changeI have created a corpus of the responses in which each text is an individual response. The summary shows how many types, tokens, and sentences are in each response. This is utterly uninteresting information for this particular corpus and research question but it’s good to practice.
Next I need to make some decisions about pre-processing. Some options include:
# tokenize
change_tokens <- tokens(change_corpus,
    remove_punct = T) # remove punctuation
change_tokens <- tokens_tolower(change_tokens) # remove capitalization

save(change_tokens, file = "change_tokens.RData")

# view
print(change_tokens)
Tokens consisting of 215 documents.
text1 :
[1] "more" "concentration" "on" "the"
[5] "basic" "good" "groups"
text2 :
[1] "i'd" "like" "to" "see" "more"
[6] "storytelling" "around" "regenerative" "agriculture"
text3 :
[1] "factual" "evidence-based" "relationships" "are"
[5] "not" "widely" "understood" "between"
[9] "local" "food" "resilience" "climate"
[ ... and 70 more ]
text4 :
[1] "whatever" "it" "takes" "to" "get"
[6] "nutritious" "sustainable" "food" "into" "the"
[11] "hands" "of"
[ ... and 25 more ]
text5 :
[1] "more" "competitive" "prices" "for" "local"
[6] "produce"
text6 :
[1] "more" "education" "about" "local" "sustainable"
[6] "food" "and" "relationship" "to" "climate"
[11] "change"
[ reached max_ndoc ... 209 more documents ]Things I’m thinking about right now:
# create document feature matrix
change_dfm <- dfm(change_tokens)

save(change_dfm, file = "change_dfm.RData")

# view
print(change_dfm)
Document-feature matrix of: 215 documents, 1,252 features (98.44% sparse) and 0 docvars.
features
docs more concentration on the basic good groups i'd like to
text1 1 1 1 1 1 1 1 0 0 0
text2 1 0 0 0 0 0 0 1 1 1
text3 0 0 0 1 0 0 0 0 0 2
text4 0 0 0 1 0 0 0 0 1 1
text5 1 0 0 0 0 0 0 0 0 0
text6 1 0 0 0 0 0 0 0 0 1
[ reached max_ndoc ... 209 more documents, reached max_nfeat ... 1,242 more features ]Again, this yields an enormous volume of uninteresting, unsurprising data (part of the reason is likely that I haven’t removed any stopwords yet).
# get 10 most frequent terms
topfeatures(change_dfm, 10)
to and food more local the for of a in
200 197 157 132 123 110 103 98 78 65 I’m going to create a separate object for my corpus with the stopwords removed so that I can compare the document feature matrices and most frequent words side-by-side.
# create new object
change_tokens_no_stop <- tokens_select(change_tokens,
                                       pattern = stopwords("en"),
                                       selection = "remove")
# create new dfm
change_no_stop_dfm <- dfm(change_tokens_no_stop)

save(change_no_stop_dfm, file = "change_no_stop_dfm.RData")

# get 10 most frequent terms
topfeatures(change_no_stop_dfm, 10)
food local land like farmers see affordable
157 123 38 37 37 34 33
community locally options
28 28 22 Hmm, interesting. Much more informative but some of the most frequent words are 1) completely expected, and 2) not substantively meaningful on their own.
For example, I would expect “food” to be mentioned frequently but without any sense of what the respondent has said about it, it’s not meaningful. The survey is about the food system so their answer should have something to do with food.
I’ll need to think about this more.
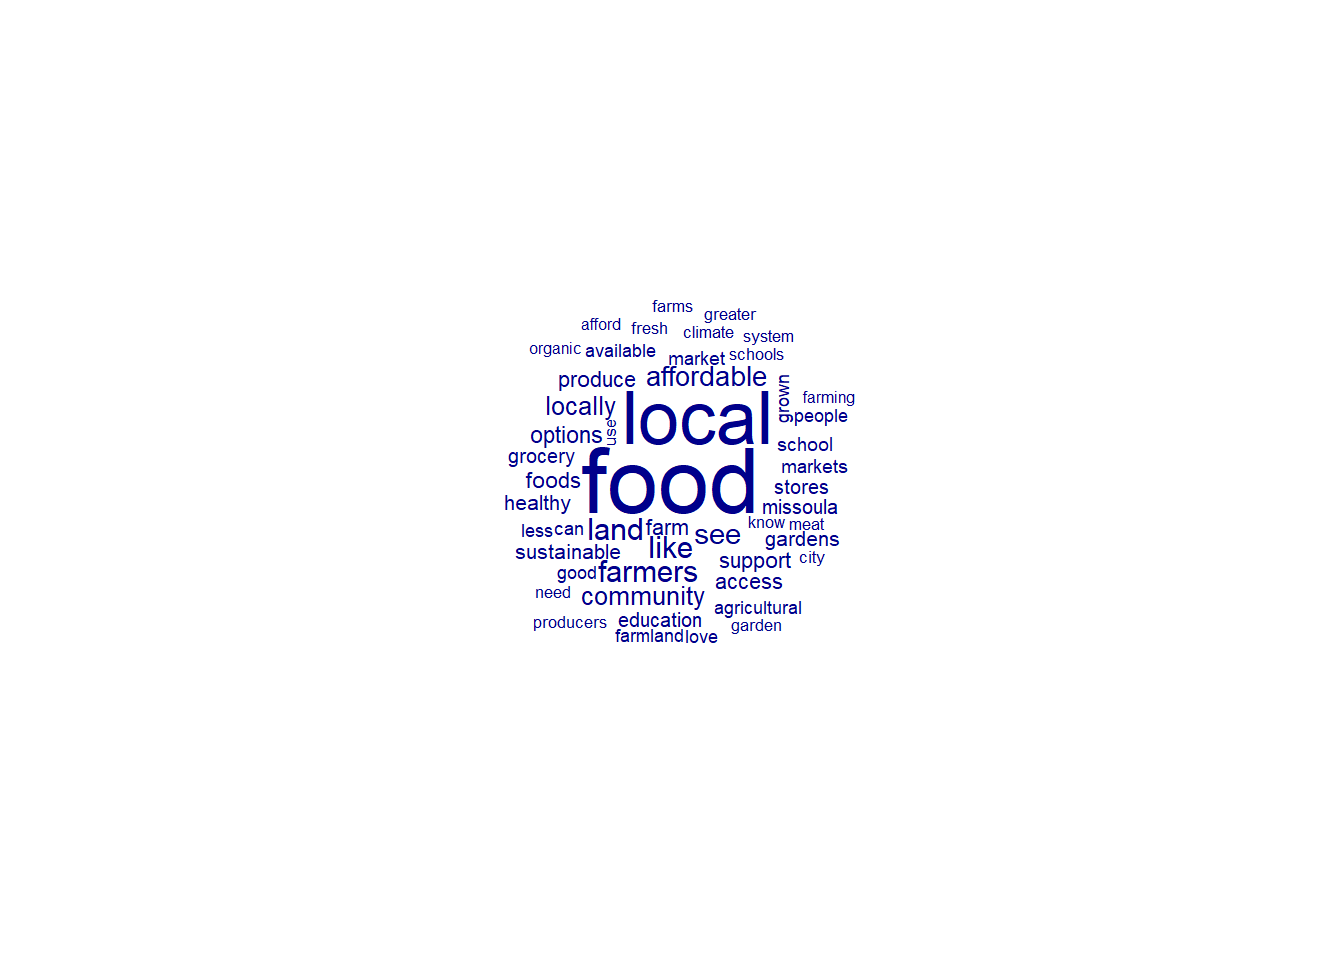
Just for fun, though, I’ll create a word cloud of the 10 most frequent terms.
# create wordcloud
textplot_wordcloud(change_no_stop_dfm, min_count = 5, max_words = 50, random_order = FALSE)