Code
library(plyr)
library(tidyverse)
library(tidytext)
library(quanteda)
library(devtools)
library(quanteda.dictionaries)
library(quanteda.sentiment)

knitr::opts_chunk$set(echo = TRUE)library(plyr)
library(tidyverse)
library(tidytext)
library(quanteda)
library(devtools)
library(quanteda.dictionaries)
library(quanteda.sentiment)
knitr::opts_chunk$set(echo = TRUE)In this post I’ll be applying dictionary methods to my corpus. My corpus is the responses to the open-text survey question “What changes would you like to see for Missoula’s food system?” As I understand it, utilizing dictionary methods to analyze a corpus essentially entails measuring the frequency with which words in a given lexicon appear the corpus. I haven’t found any pre-existing lexicons that are relevant to my corpus so I believe that I will ultimately need to create my own to really analyze this corpus using dictionary methods. For today, though, I will use existing dictionaries just to practice.
# load corpus from blog post 3
load("change_corpus.RData")

# load dfm from blog post 3
load("change_no_stop_dfm.RData")
First I’ll try the liwcalike() function from quanteda.dictionaries.
# use liwcalike
change_sentimentNRC <- liwcalike(change_corpus, data_dictionary_NRC)

names(change_sentimentNRC)
[1] "docname" "Segment" "WPS" "WC" "Sixltr"
[6] "Dic" "anger" "anticipation" "disgust" "fear"
[11] "joy" "negative" "positive" "sadness" "surprise"
[16] "trust" "AllPunc" "Period" "Comma" "Colon"
[21] "SemiC" "QMark" "Exclam" "Dash" "Quote"
[26] "Apostro" "Parenth" "OtherP" # create plot for positive
ggplot(change_sentimentNRC) +
geom_histogram(aes(x = positive)) +
theme_bw()`stat_bin()` using `bins = 30`. Pick better value with `binwidth`.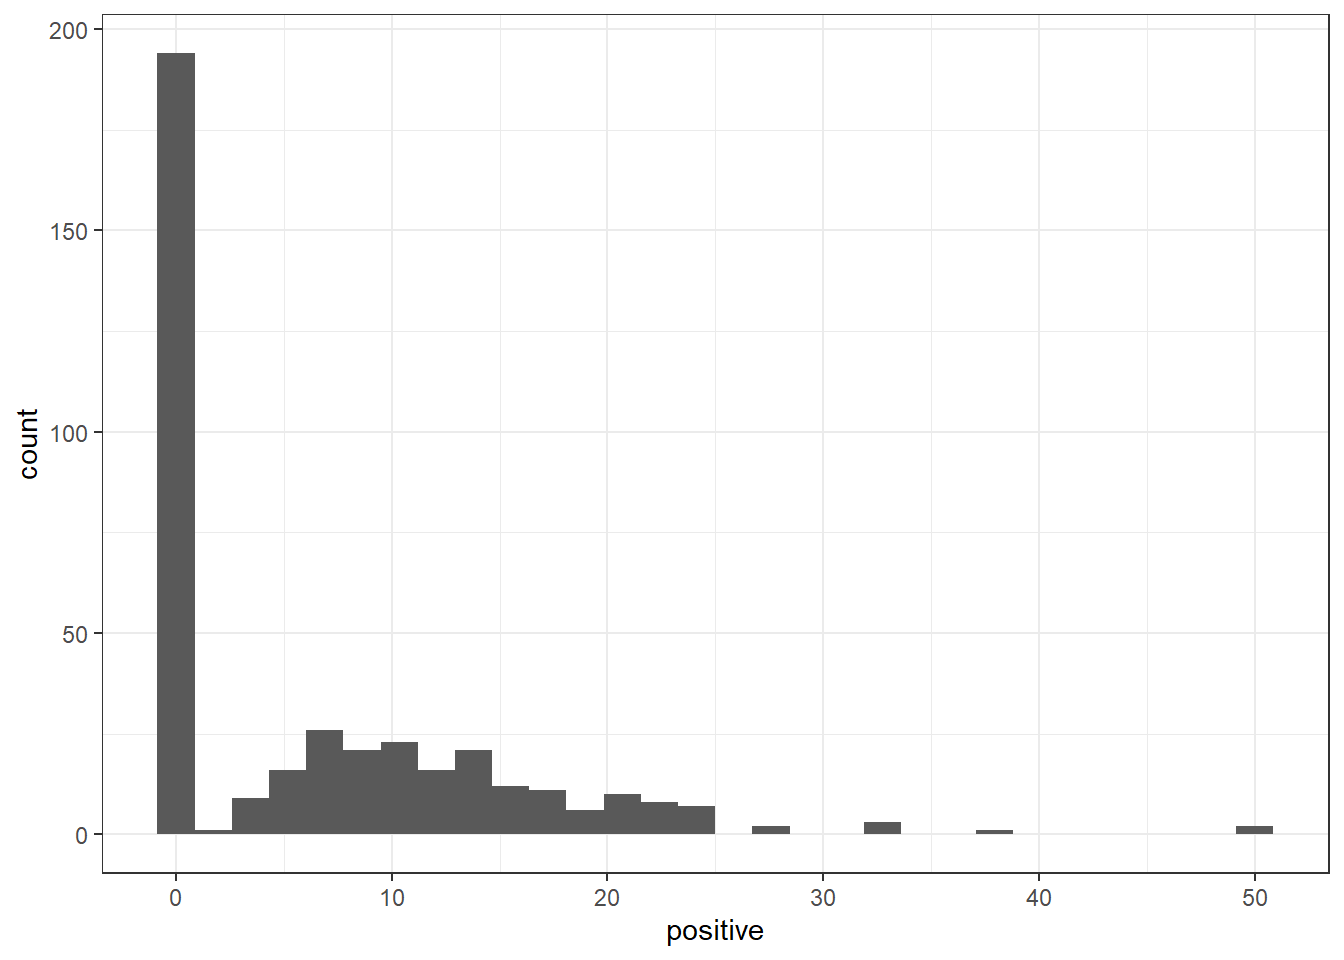
# create plot for negative
ggplot(change_sentimentNRC) +
  geom_histogram(aes(x = negative)) +
  theme_bw()
`stat_bin()` using `bins = 30`. Pick better value with `binwidth`.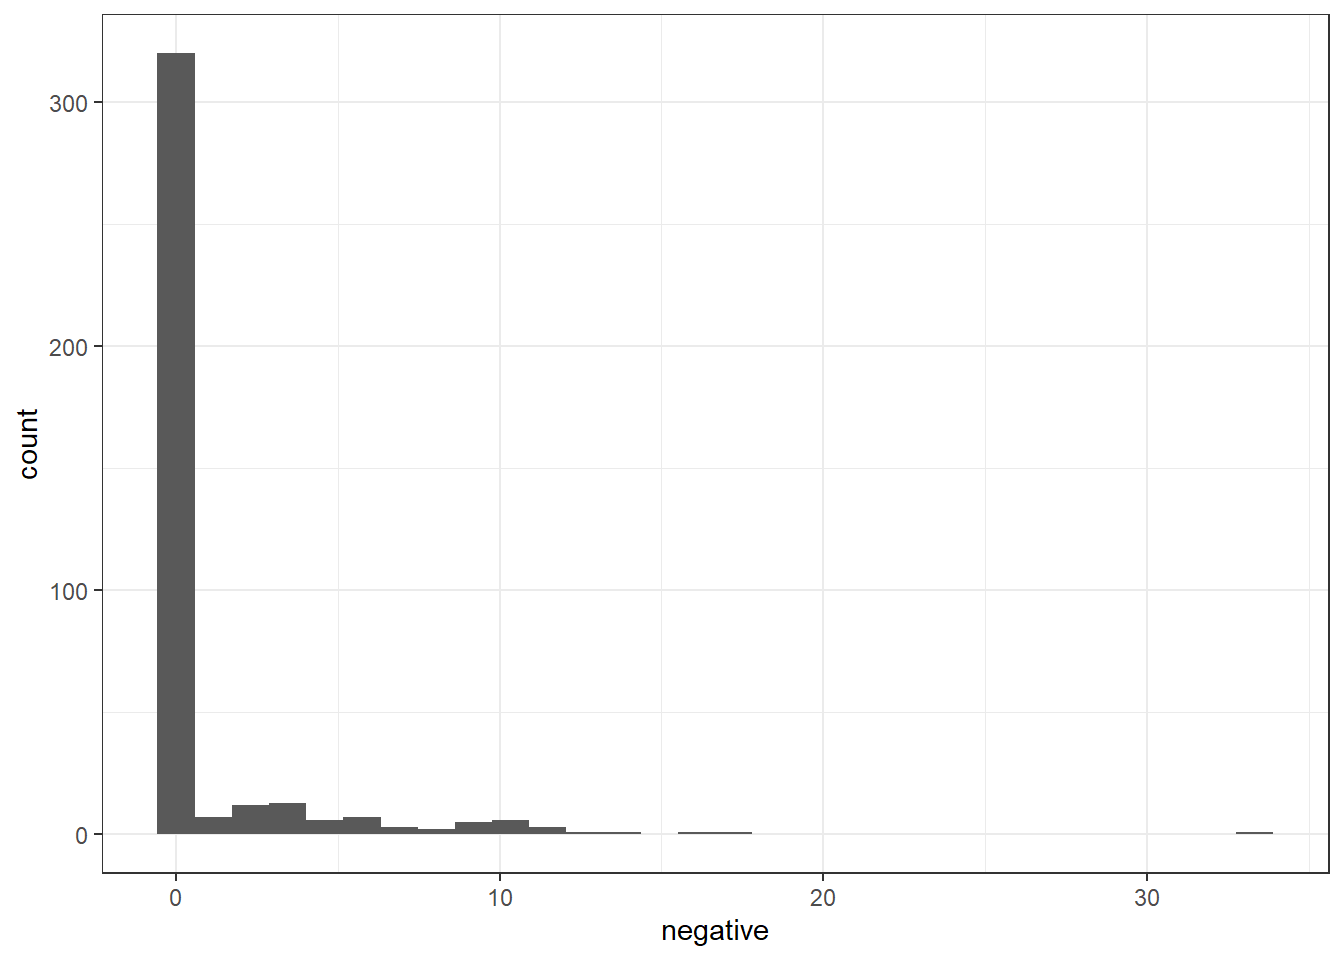
If I’m understanding these plots correctly, the vast majority of responses have not been categorized as either positive or negative. This makes sense given the question “What changes would you like to see for Missoula’s food system?” While respondents may have (and quite likely do have) positive or negative feelings about the Missoula food system, the question doesn’t specifically ask about those feelings.
Next I’ll create a document feature matrix using a dictionary.
# create dfm with NRC dictionary
change_sentimentNRC_dfm <- tokens(change_corpus,
                         remove_punct = TRUE,
                         remove_symbols = TRUE,
                         remove_numbers = TRUE,
                         remove_url = TRUE,
                         split_hyphens = FALSE,
                         include_docvars = TRUE) %>%
  tokens_tolower() %>%
  dfm() %>%
  dfm_lookup(data_dictionary_NRC)

# preview
head(change_sentimentNRC_dfm, 10)
Document-feature matrix of: 10 documents, 10 features (57.00% sparse) and 0 docvars.
features
docs anger anticipation disgust fear joy negative positive sadness surprise
text1 0 1 0 0 1 0 1 0 1
text2 0 0 0 0 0 0 0 0 0
text3 0 0 0 0 0 0 1 0 0
text4 2 3 1 2 4 4 7 1 2
text5 1 0 2 2 1 2 2 2 0
text6 0 0 0 0 0 0 0 0 0
features
docs trust
text1 1
text2 0
text3 0
text4 3
text5 1
text6 0
[ reached max_ndoc ... 4 more documents ]Next I’ll do the same thing but use a different dictionary.
# create dfm with Gen Inq dictionary
change_sentimentGenInq_dfm <- change_no_stop_dfm %>%
  dfm_lookup(data_dictionary_geninqposneg)

# preview
head(change_sentimentGenInq_dfm, 10)
Document-feature matrix of: 10 documents, 2 features (50.00% sparse) and 0 docvars.
features
docs positive negative
text1 2 0
text2 0 0
text3 1 0
text4 7 2
text5 2 2
text6 0 0
[ reached max_ndoc ... 4 more documents ]At least from these previews there seems to be reasonable agreement between the two dictionaries. I’m going to look at the actual documents to see if I can get a sense of what is being categorized as positive and negative.
# preview corpus
head(change_corpus, 10)
Corpus consisting of 10 documents.
text1 :
"More concentration on the basic good groups"
text2 :
""
text3 :
"I'd like to see more storytelling around regenerative agricu..."
text4 :
"Factual, evidence-based relationships are not widely underst..."
text5 :
"Whatever it takes to get nutritious sustainable food into th..."
text6 :
""
[ reached max_ndoc ... 4 more documents ]Interesting. Based on the categorizations of the above text, I don’t ultimately think that analyzing sentiment of the responses is really appropriate. Many of the above documents are neither positive nor negative but are being categorized as one or the other. I also think that given the question that produced these responses, analyzing sentiment isn’t especially interesting. I am more interested in a method that will allow me to understand the actual changes respondents would like to see.
I will continue to look for an appropriate dictionary to use for my corpus. I also need to practice these methods a bit more, as I feel that there are parts I don’t really understand yet.