Code
import nltk
import re
from string import digits
import pandas as pd
import seaborn as sns
import matplotlib.pyplot as pltimport nltk
import re
from string import digits
import pandas as pd
import seaborn as sns
import matplotlib.pyplot as pltResearch question: how does lock down change people’s perception of remote working dataset: twitter dataset with key words: #remotework, #workfromhome, #wfh
# load remote work twitter dataset
df = pd.read_csv('cleaned_twitter_remotework.csv').dropna().reset_index()
Looking at stay at home order across different states, most of the enforced order were initialized during 2020, 03 to 2020, 05. I wana see how people perceive remote work befor lockdown, during lockdown and after lockdown, whether there are any differences. Following are the topic model for each period
# split dataset with three time period: pre lockdown, during lockdown and after lockdown
from pandas import Timestamp
df['created_at']= df['created_at'].apply(lambda x: datetime.datetime.strptime(x,"%Y-%m-%d %H:%M:%S%z"))
df['date'] = df['created_at'].apply(lambda x: x.date())
df['year'] = df['created_at'].apply(lambda x: x.year)
df['month'] = df['created_at'].apply(lambda x: x.month)
df_pre_lockdown = df[df['created_at'] < Timestamp('2020-3-01 00:00:00+0000', tz='UTC')].reset_index(drop = True)
df_du_lockdown = df[(df['created_at'] > Timestamp('2020-3-01 00:00:00+0000', tz='UTC'))&(df['created_at'] < Timestamp('2020-6-01 00:00:00+0000', tz='UTC'))].reset_index(drop = True)
df_after_lockdown =df[df['created_at'] > Timestamp('2020-6-01 00:00:00+0000', tz='UTC')].reset_index(drop = True)
As mentioned by Professor Song, each tweet is too short to cover multiple topics, so I merged tweets by date.
df_pre_agg = df_pre_lockdown.groupby(['year','month','date'])['lematize_text'].apply(lambda x: ', '.join(x)).reset_index()
# topic model for pre_lockdown tweets
import gensim
import gensim.corpora as corpora
from pprint import pprint
import pyLDAvis
import pyLDAvis.gensim_models as gensimvis
import gensim.corpora as corpora
def sent_to_words(sentences):
    '''
    tokenize words
    '''
    for sentence in sentences:
        yield(gensim.utils.simple_preprocess(str(sentence), deacc=True))            #deacc=True removes punctuations
data_words = list(sent_to_words(df_pre_agg['lematize_text'].values.tolist()))
# Create Dictionary
id2word = corpora.Dictionary(data_words)
# Create Corpus
texts = data_words
# Term Document Frequency
corpus = [id2word.doc2bow(text) for text in texts]
# number of topics
num_topics = 2
# Build LDA model
lda_model = gensim.models.ldamodel.LdaModel(corpus=corpus,
                                       id2word=id2word,
                                       num_topics=num_topics,
                                       random_state=100,
                                      update_every=1,
                                      chunksize=100,
                                      passes=10,
                                      alpha='auto')
pyLDAvis.enable_notebook()
vis = gensimvis.prepare(lda_model, corpus, id2word, mds='mmds')
vis
/Users/yanshi/opt/anaconda3/lib/python3.9/site-packages/pyLDAvis/_prepare.py:246: FutureWarning: In a future version of pandas all arguments of DataFrame.drop except for the argument 'labels' will be keyword-only
default_term_info = default_term_info.sort_values(
/Users/yanshi/opt/anaconda3/lib/python3.9/site-packages/past/builtins/misc.py:45: DeprecationWarning: the imp module is deprecated in favour of importlib; see the module's documentation for alternative uses
from imp import reload
/Users/yanshi/opt/anaconda3/lib/python3.9/site-packages/past/builtins/misc.py:45: DeprecationWarning: the imp module is deprecated in favour of importlib; see the module's documentation for alternative uses
from imp import reload
/Users/yanshi/opt/anaconda3/lib/python3.9/site-packages/past/builtins/misc.py:45: DeprecationWarning: the imp module is deprecated in favour of importlib; see the module's documentation for alternative uses
from imp import reload
/Users/yanshi/opt/anaconda3/lib/python3.9/site-packages/past/builtins/misc.py:45: DeprecationWarning: the imp module is deprecated in favour of importlib; see the module's documentation for alternative uses
from imp import reload
/Users/yanshi/opt/anaconda3/lib/python3.9/site-packages/past/builtins/misc.py:45: DeprecationWarning: the imp module is deprecated in favour of importlib; see the module's documentation for alternative uses
from imp import reload
/Users/yanshi/opt/anaconda3/lib/python3.9/site-packages/past/builtins/misc.py:45: DeprecationWarning: the imp module is deprecated in favour of importlib; see the module's documentation for alternative uses
from imp import reload
/Users/yanshi/opt/anaconda3/lib/python3.9/site-packages/past/builtins/misc.py:45: DeprecationWarning: the imp module is deprecated in favour of importlib; see the module's documentation for alternative uses
from imp import reload
/Users/yanshi/opt/anaconda3/lib/python3.9/site-packages/past/builtins/misc.py:45: DeprecationWarning: the imp module is deprecated in favour of importlib; see the module's documentation for alternative uses
from imp import reloadI tried different number of topics and found out that 2 topics are the easiest to interpret with lambda around 0.5: topic 1 is related to how entreprenteur can utilize and benefit from remote work and topic 2 is how business in general can utilize remote work
df_pre_agg = df_du_lockdown.groupby(['year','month','date'])['lematize_text'].apply(lambda x: ', '.join(x)).reset_index()
# topic model for pre_lockdown tweets
data_words = list(sent_to_words(df_du_agg['lematize_text'].values.tolist()))
# Create Dictionary
id2word = corpora.Dictionary(data_words)
# Create Corpus
texts = data_words
# Term Document Frequency
corpus = [id2word.doc2bow(text) for text in texts]
# number of topics
num_topics = 2
# Build LDA model
lda_model = gensim.models.ldamodel.LdaModel(corpus=corpus,
                                       id2word=id2word,
                                       num_topics=num_topics,
                                       random_state=100,
                                      update_every=1,
                                      chunksize=100,
                                      passes=10,
                                      alpha='auto')
pyLDAvis.enable_notebook()
vis = gensimvis.prepare(lda_model, corpus, id2word, mds='mmds')
vis
/Users/yanshi/opt/anaconda3/lib/python3.9/site-packages/pyLDAvis/_prepare.py:246: FutureWarning: In a future version of pandas all arguments of DataFrame.drop except for the argument 'labels' will be keyword-only
default_term_info = default_term_info.sort_values(During the lockdown, most people were talking about remote work in general, like how they conduct remote work; some people mentioned the benefits of remote work, especially for mother and women
df_af_agg = df_after_lockdown.groupby(['year','month','date'])['lematize_text'].apply(lambda x: ', '.join(x)).reset_index()
data_words = list(sent_to_words(df_af_agg['lematize_text'].values.tolist()))
# Create Dictionary
id2word = corpora.Dictionary(data_words)
# Create Corpus
texts = data_words
# Term Document Frequency
corpus = [id2word.doc2bow(text) for text in texts]
# number of topics
num_topics = 2
# Build LDA model
lda_model = gensim.models.ldamodel.LdaModel(corpus=corpus,
                                       id2word=id2word,
                                       num_topics=num_topics,
                                       random_state=100,
                                      update_every=1,
                                      chunksize=100,
                                      passes=10,
                                      alpha='auto')
pyLDAvis.enable_notebook()
vis = gensimvis.prepare(lda_model, corpus, id2word, mds='mmds')
vis
/Users/yanshi/opt/anaconda3/lib/python3.9/site-packages/pyLDAvis/_prepare.py:246: FutureWarning: In a future version of pandas all arguments of DataFrame.drop except for the argument 'labels' will be keyword-only
default_term_info = default_term_info.sort_values(Here you can find out that people’s perceptions towards remote work are slowly merging, indicating a collective perceptions and emotiongs are forming. Topic 1 contains 95% of the token (text content), while topic 2 only covers 5%. Meanwhile, topic 1 includes some clear positive emotions such as love, like, suggesting public reached a collective positive emotions towards remote work.
Lets looks at states with enforced stay at home order, California; and states with shelter in place, Texas
# load top 12 states with most remote work twitters, date of stay at home order and whether enforced order
dfs = pd.read_excel('states stay at home order timeline.xlsx', engine='openpyxl')
# filter twiteers based on 12 states
data = df[df['states_abbrev'].isin(dfs['states_abbrev'])]
df2 = []
for x in dfs.index:
df2.append(data.loc[data['states_abbrev'] == dfs['states_abbrev'][x]]) # generate new dataframe
df1 = pd.concat(df2)
df1 = df1.reset_index(drop = True)# map stay at home order date
start_dict = dict(zip(dfs['states_abbrev'], dfs['start']))
end_dict = dict(zip(dfs['states_abbrev'], dfs['end']))
df1['start'] = df1['states_abbrev'].map(start_dict)
df1['end'] = df1['states_abbrev'].map(end_dict)# map enforced or mild stay at home order
df1['lockdown'] = df1.apply(lambda x: 1 if (x['start'] < x['date'])&(x['end']>x['date']) else 0, axis =1 )
from IPython.core.interactiveshell import InteractiveShell
InteractiveShell.ast_node_interactivity = "all"
stay_at_home = dict(zip(dfs['states_abbrev'], dfs['Enforced_stay_at_home_order']))
df1['enforced_order'] = df1['states_abbrev'].map(stay_at_home)
df1['enforced_order'] = df1['enforced_order'].apply(lambda x: 1 if x == 'Y' else 0)/var/folders/yn/83gzh79s0dv70yn_zgdzgg7m0000gn/T/ipykernel_14272/439337444.py:2: FutureWarning: Comparison of Timestamp with datetime.date is deprecated in order to match the standard library behavior. In a future version these will be considered non-comparable.Use 'ts == pd.Timestamp(date)' or 'ts.date() == date' instead.
df1['lockdown'] = df1.apply(lambda x: 1 if (x['start'] < x['date'])&(x['end']>x['date']) else 0, axis =1 )# create year and month column for data aggragation
import time
import datetime
df1['year'] = df1['created_at'].apply(lambda x: x.year)
df1['month'] = df1['created_at'].apply(lambda x: x.month)# filter two states
df_ca = df1[df1['states_abbrev'] == 'CA'].drop(columns = ['Unnamed: 0', 'index'])
df_ca['tweets'] = 1
df_tx = df1[df1['states_abbrev'] == 'TX'].drop(columns = ['Unnamed: 0', 'index'])
df_tx['tweets'] = 1# aggregate data in month
df_ca['date'] = pd.to_datetime(df_ca['date'], errors='coerce')
per = df_ca.date.dt.to_period("M")
df_agg_ca = df_ca.groupby(per).sum()
df_agg_ca['date'] = df_agg_ca.index
df_agg_ca['state'] = 'CA'
df_agg_ca = df_agg_ca.reset_index(drop = True).drop(columns = ['year', 'month', 'author_id', 'author_followers', 'author_tweets'])
df_tx['date'] = pd.to_datetime(df_tx['date'], errors='coerce')
per = df_tx.date.dt.to_period("M")
df_agg_tx = df_tx.groupby(per).sum()
df_agg_tx['date'] = df_agg_tx.index
df_agg_tx['state'] = 'TX'
df_agg_tx = df_agg_tx.reset_index(drop = True).drop(columns = ['year', 'month', 'author_id', 'author_followers', 'author_tweets'])# concat aggregate data
frames = [df_agg_ca, df_agg_tx]
result = pd.concat(frames).reset_index()
result['lockdown'] = result['lockdown'].apply(lambda x: 'Y' if x >0 else 'N')
result['enforced_order'] = result['enforced_order'].apply(lambda x: 'Y' if x >0 else 'N')
result| index | retweets | replies | likes | quote_count | lockdown | enforced_order | tweets | date | state | |
|---|---|---|---|---|---|---|---|---|---|---|
| 0 | 0 | 100.0 | 9.0 | 274.0 | 12.0 | N | Y | 27 | 2019-03 | CA |
| 1 | 1 | 5.0 | 2.0 | 50.0 | 0.0 | N | Y | 29 | 2019-04 | CA |
| 2 | 2 | 4.0 | 2.0 | 27.0 | 0.0 | N | Y | 23 | 2019-05 | CA |
| 3 | 3 | 3.0 | 0.0 | 12.0 | 0.0 | N | Y | 13 | 2019-06 | CA |
| 4 | 4 | 10.0 | 14.0 | 102.0 | 2.0 | N | Y | 29 | 2019-07 | CA |
| ... | ... | ... | ... | ... | ... | ... | ... | ... | ... | ... |
| 79 | 37 | 39.0 | 9.0 | 208.0 | 3.0 | N | N | 21 | 2022-06 | TX |
| 80 | 38 | 27.0 | 2.0 | 49.0 | 0.0 | N | N | 15 | 2022-07 | TX |
| 81 | 39 | 11.0 | 8.0 | 96.0 | 0.0 | N | N | 18 | 2022-08 | TX |
| 82 | 40 | 7.0 | 4.0 | 59.0 | 0.0 | N | N | 10 | 2022-09 | TX |
| 83 | 41 | 1.0 | 0.0 | 0.0 | 0.0 | N | N | 2 | 2022-10 | TX |
84 rows × 10 columns
plt.figure(figsize=(20,5))
sns.pointplot(x='date',y='tweets',data=result, hue='state')
plt.tick_params(axis='x', labelrotation = 45)
plt.title("Monthly remote working tweet by state")
<Figure size 1440x360 with 0 Axes><AxesSubplot:xlabel='date', ylabel='tweets'>Text(0.5, 1.0, 'Monthly remote working tweet by state')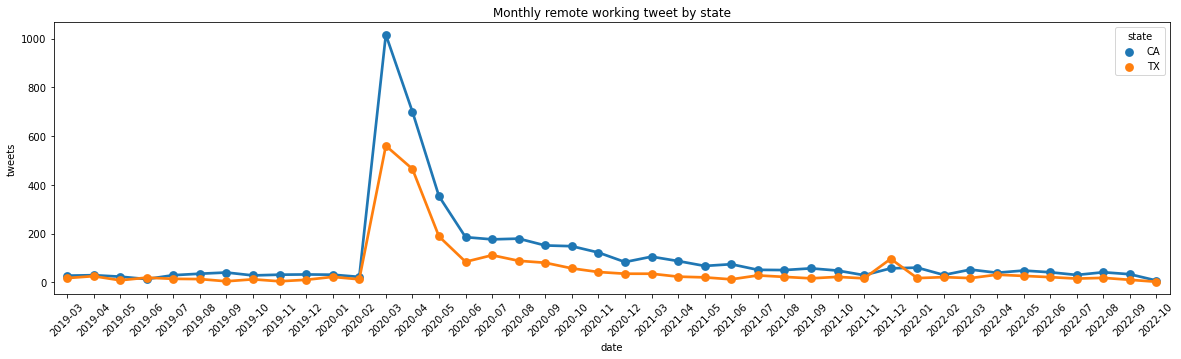
Before lockdown, CA and TX has similar number of tweets for remote working, but after the stay at home order announced, CA’s tweets related to remote work quickly went over TX, indicating people may be affected more by enforced stay at home order than mild shelter in place order. Because people are forced to work remote, they perceive this as a big change in their life, and therefore are more likely to share experience.
sns.catplot(data=result, x="enforced_order", y="tweets", hue="lockdown", kind="swarm")
plt.show()
<seaborn.axisgrid.FacetGrid at 0x7fbb940175b0>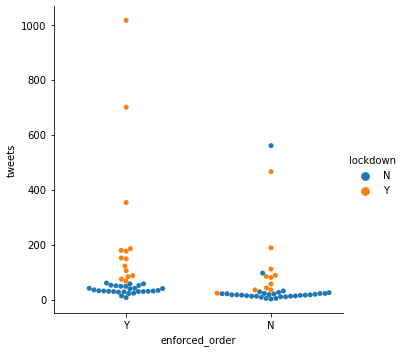
This graph shows clear that number of tweets under enforced stay at home order is higher than mild shelter in place order
sns.catplot(data=result, x="lockdown", y="tweets", hue="state", kind="bar")<seaborn.axisgrid.FacetGrid at 0x7fbb9400b4c0>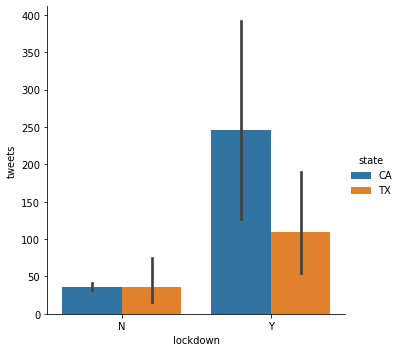
Before lockdown, the number of tweets are similar in CA and TX, while CA’s number of tweets is much higher than TX’s during lockdown, suggesting a potential variable (enforced stay at home order) may induce this change. Although we hypothese that enforced stay at home order may placy a role here, there are also other possibilities. For example, lots of technology company located in CA, workers in CA may be more eligible to switch to remote work and start tweeting.
My next plan is to implement structural topic modeling to explore more content and hopefully find some labelled emotional dataset to establish emotional classification model.